Block Trades
The lane on the right edge of the chart marks block trades in the underlying stock — institution-sized prints, each pinned to the price it actually crossed at. A bar's length is the dollar value of what traded there, scaled against the heaviest price on screen. Where several blocks hit the same price they stack into one bar, so a level that absorbed real size reads as one long mark while still showing what it was made of.
The biggest of them step onto the chart itself: each session's top eight prints by dollar value are drawn as diamonds at the price and minute they crossed, sized so that a diamond's area tracks the print's value — the largest of the day sets the scale, the rest follow in proportion. Same colour coding as the lane; hover any diamond for its value, share count, price, time and type. The lane stays the complete session record — the diamonds are the day's headline sizes, placed in context.
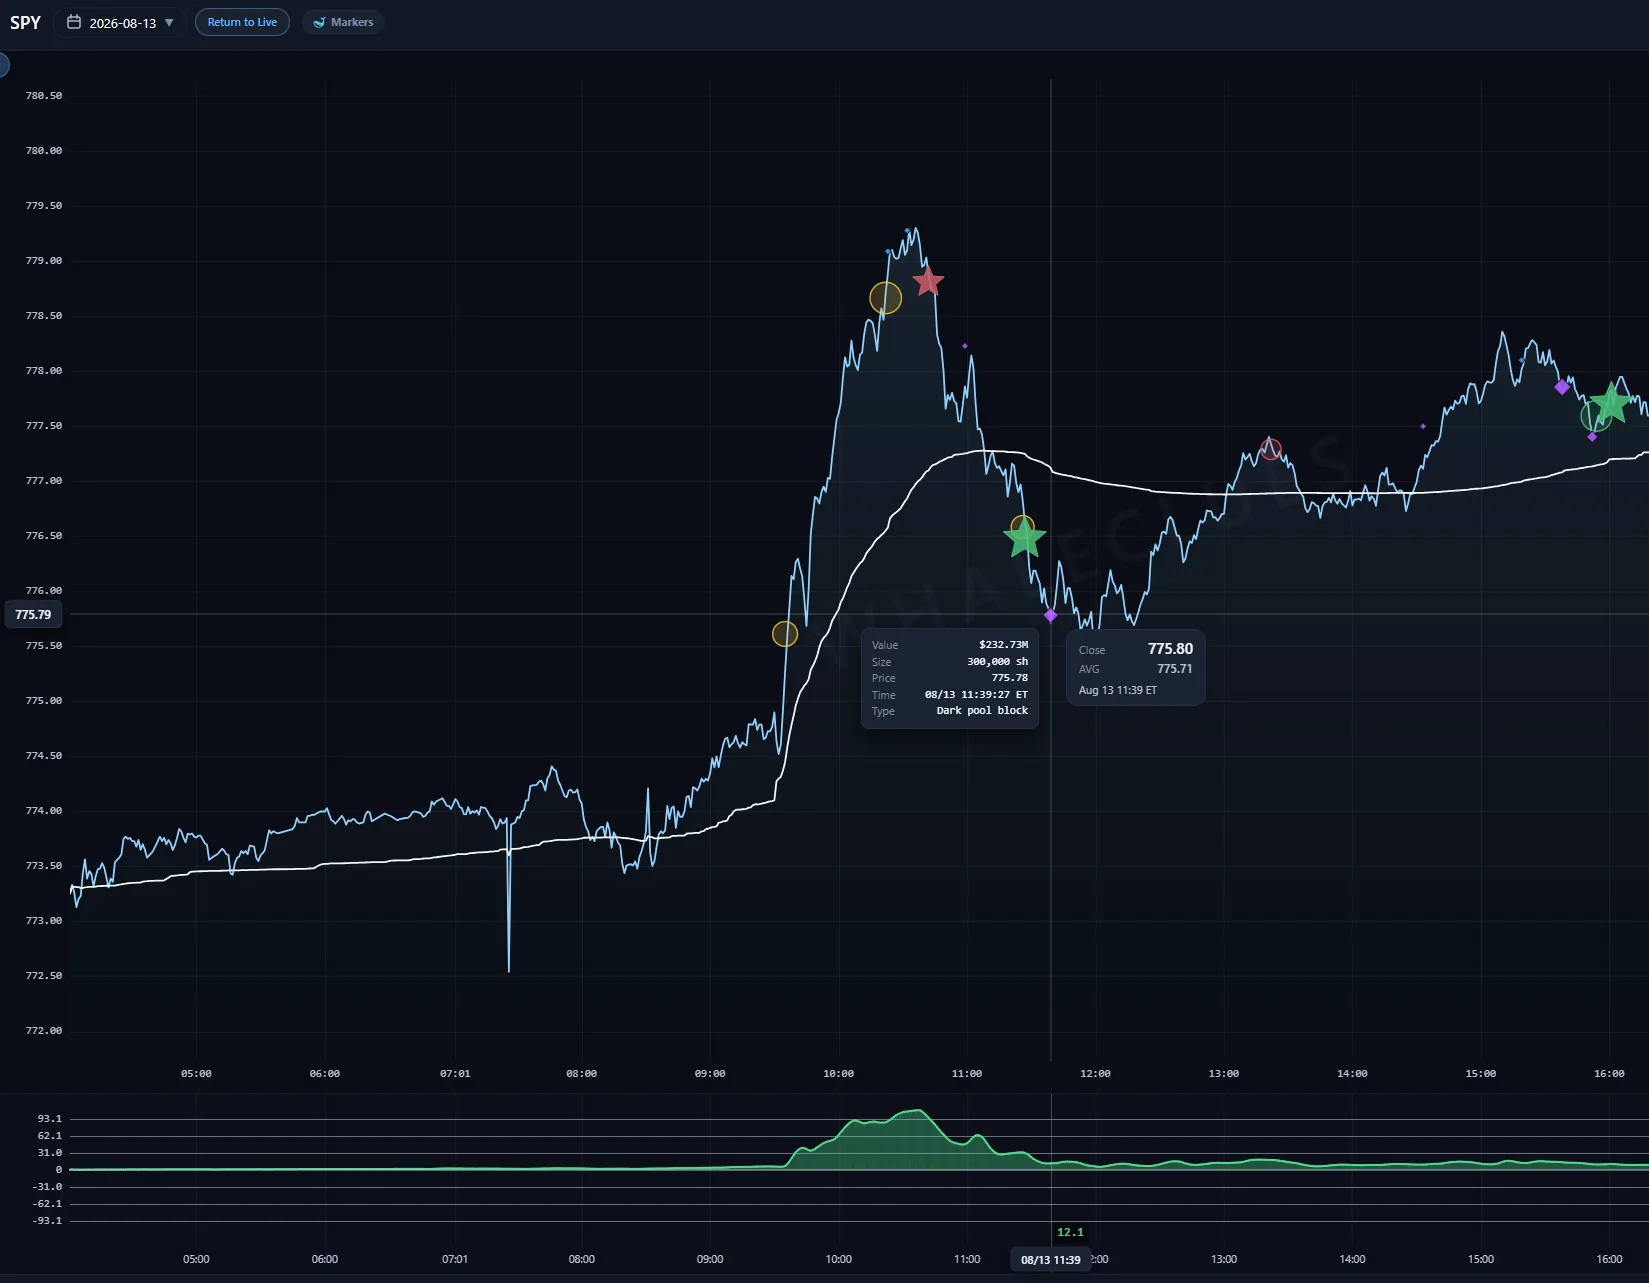
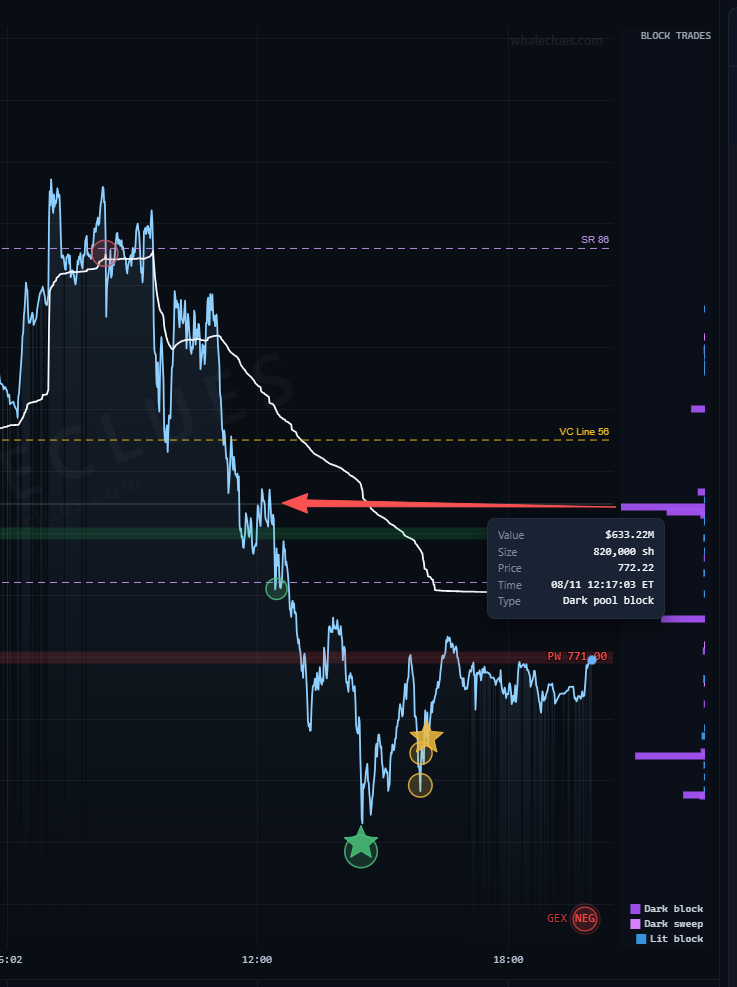
Venue and intent, on two axes
Colour carries two things at once. Hue is where it traded — purple for dark pools, blue for lit exchanges. Brightness is how it traded — a sweep is brighter than a resting block, because a sweep crossed the spread to get filled and a block waited. So the aggressive prints announce themselves without needing a separate marker. Hover any bar for its value, share count, price, time and type.
Only genuine size
The lane is already filtered before it reaches the chart: $5M+ for SPY and QQQ, $2M+ for the rest. Nothing small enough to be noise is drawn, so every bar you see is a print worth asking about. The lane covers the current session only — it answers what size committed today, not where it sat last week.
SPY's prints, in index points
An index has no shares of its own, so Implied Forward carries the prints of its proxy: the same SPY block trades, re-based to index price levels. Dollar values are the SPY prints' own — the lane and the diamonds read identically on either chart.
A bar in the lane is a receipt, not a forecast — size that already traded at that price. The biggest receipts are drawn on the chart as well, so the session below follows one print into both places: a diamond at the price and minute it crossed, a bar in the lane at its price.
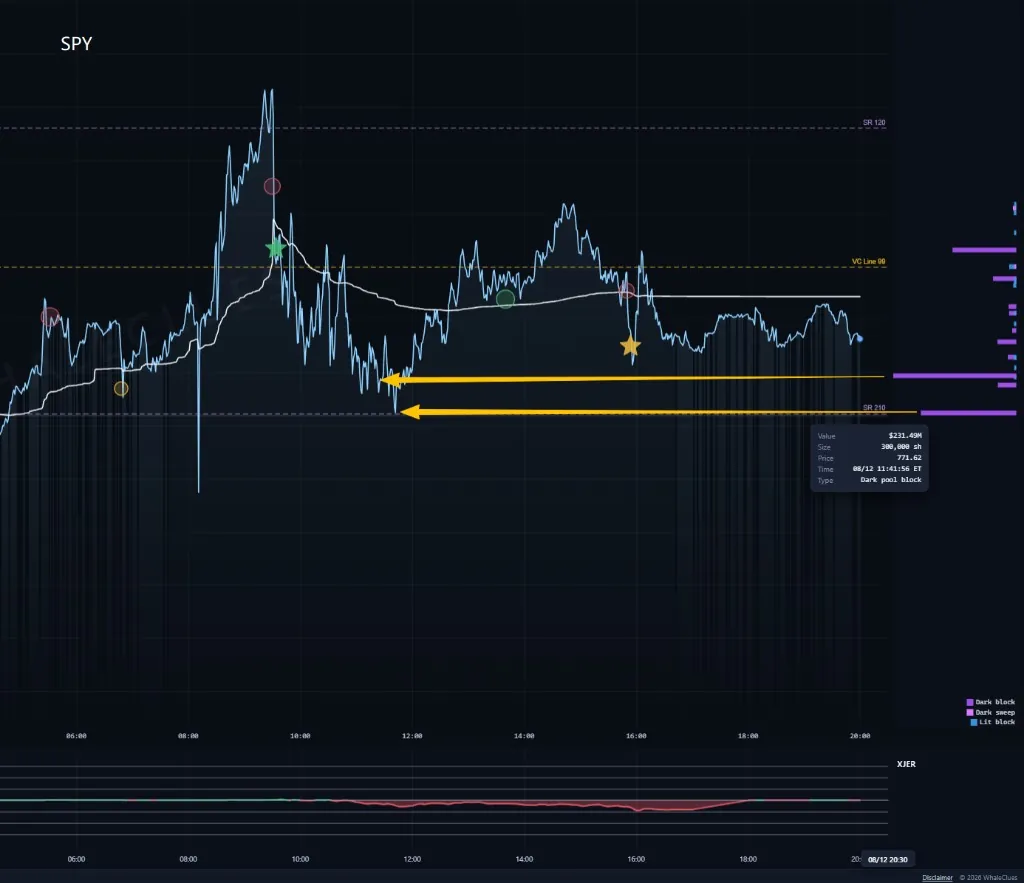
Every level on this page is live right now.
Reading about a VC Line is one thing; watching price stall against today's is another. The same markers, block prints and key levels described above are drawn on the live SPY, QQQ, IWM, DIA, GLD and SLV charts.