The Metals
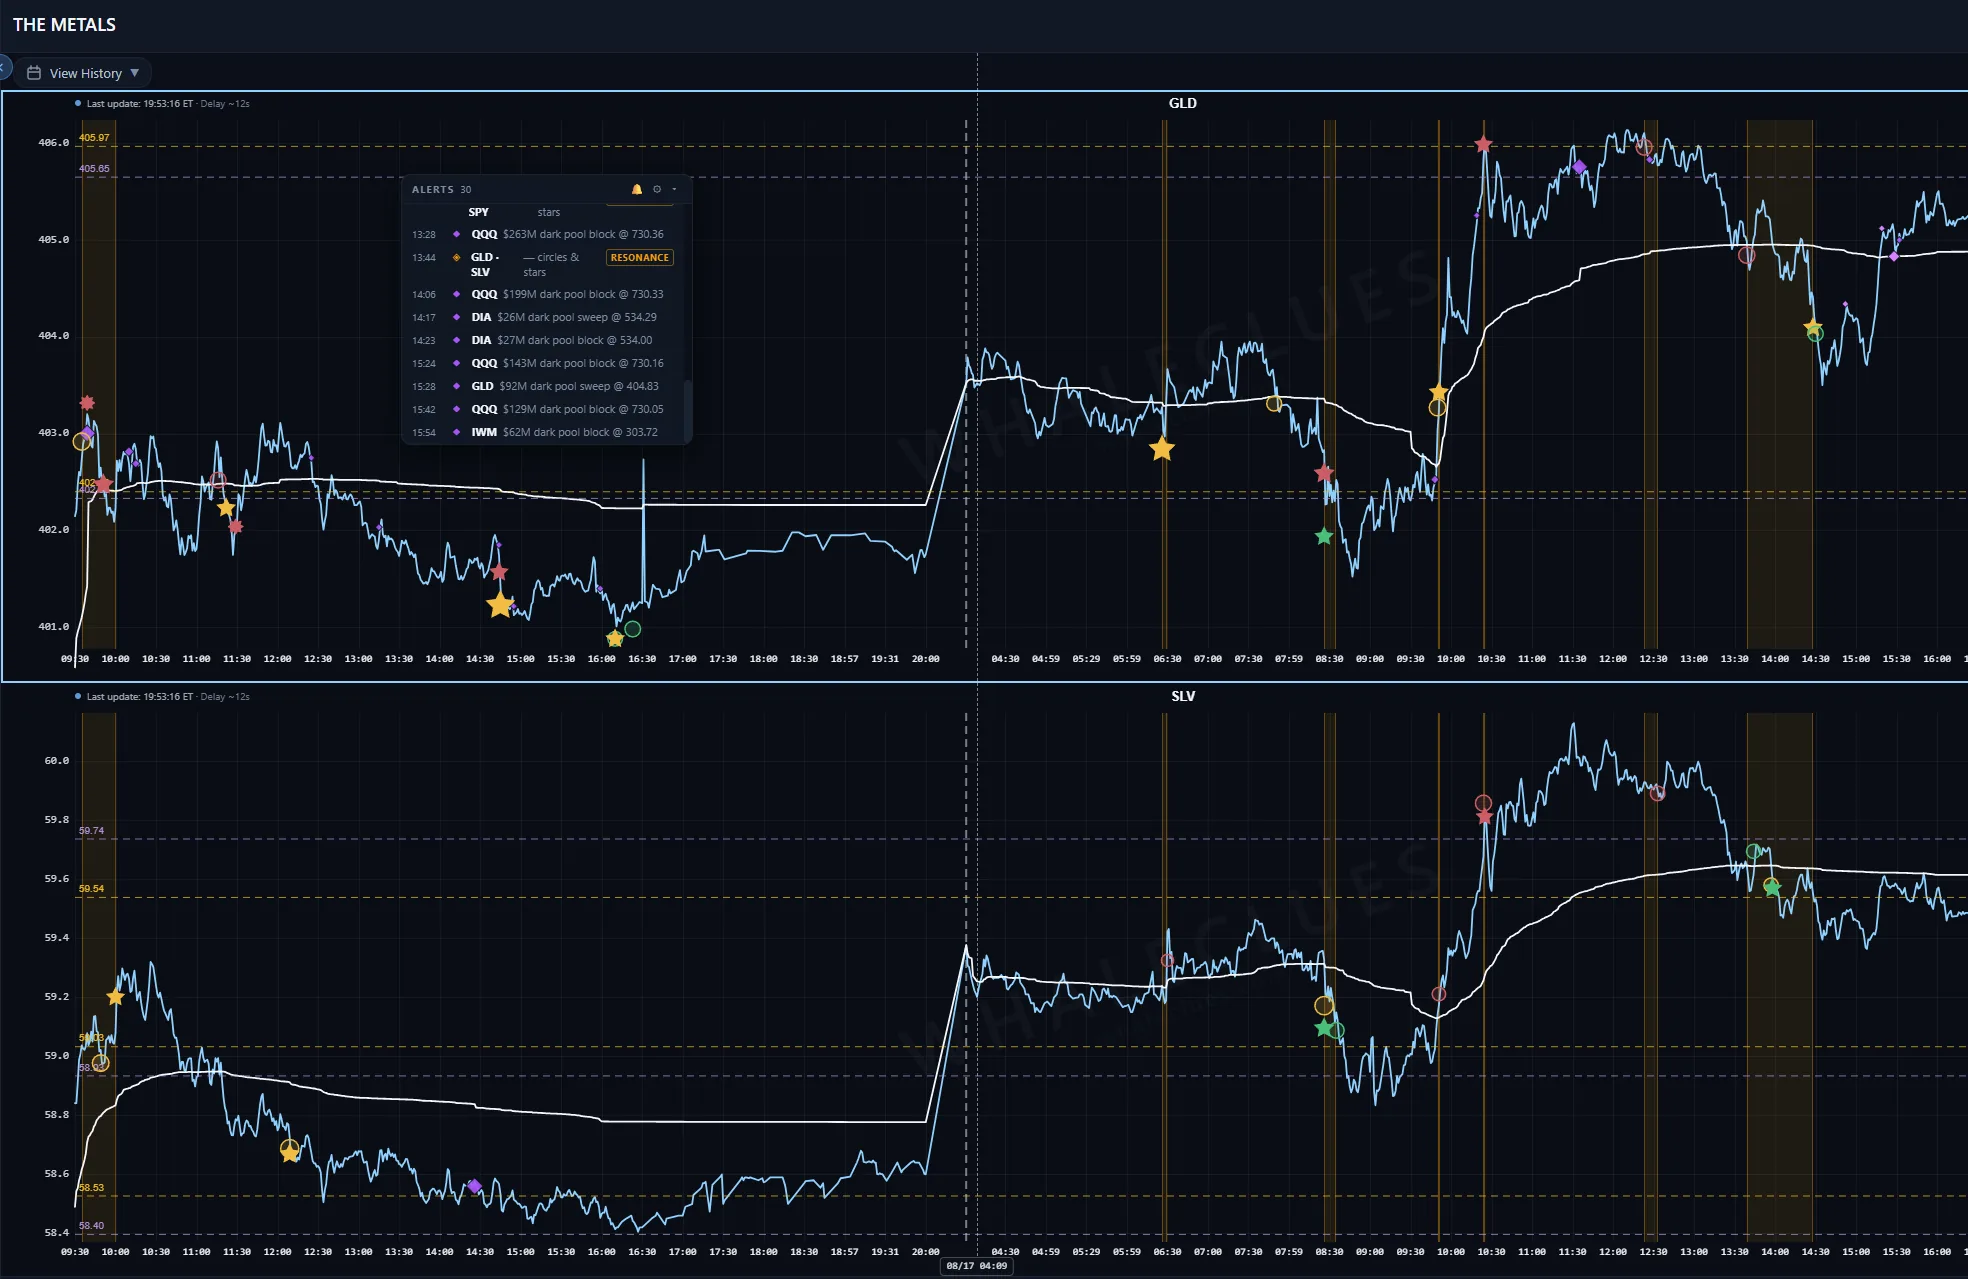
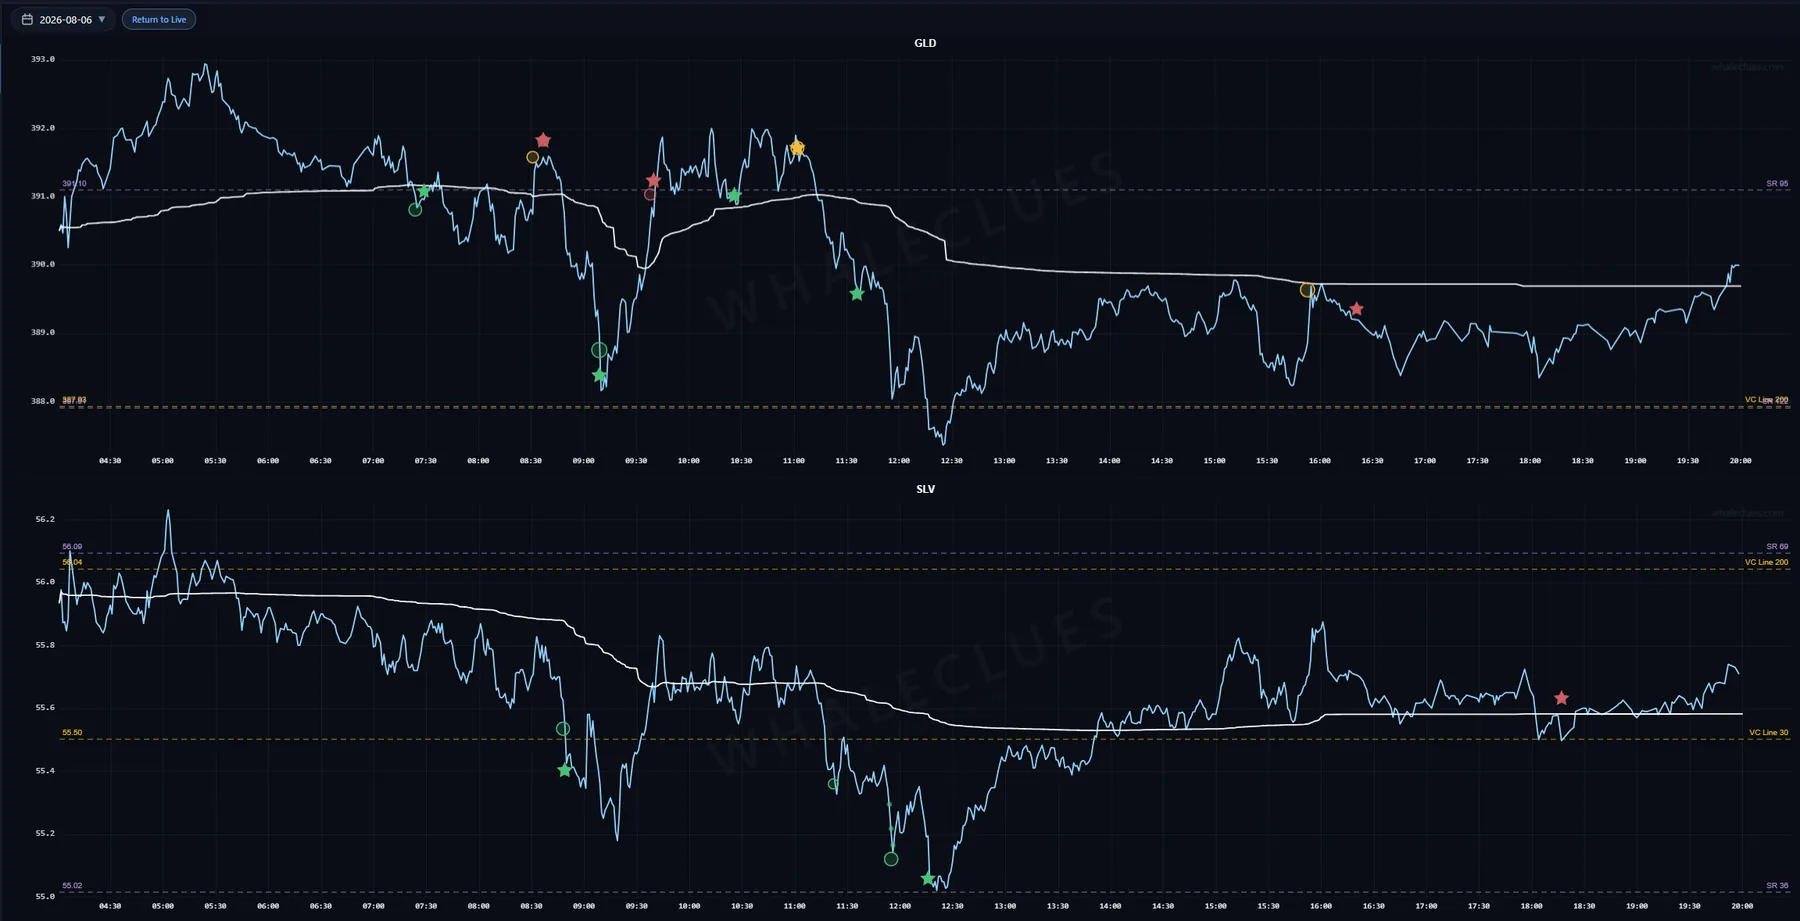
GLD (Gold) and SLV (Silver) are shown together in a single area — but only when you've subscribed to both of them. Each panel runs its own markers, block prints and key levels; the shared time axis makes lead/lag and divergence between the two metals easy to spot.
Metals get the same resonance read: when both print Stars, Circles or Suns close together, a shaded time-band marks that window across the two panels, with a matching line in the alert feed. The shade follows the same rule as the index bands — blue, pink or amber — and means no more than that; with only two legs an amber stand-off is common. It is drawn with the metals combo and shows on historical dates too.
Every level on this page is live right now.
Reading about a VC Line is one thing; watching price stall against today's is another. The same markers, block prints and key levels described above are drawn on the live SPY, QQQ, IWM, DIA, GLD and SLV charts.