US Equity Indexes
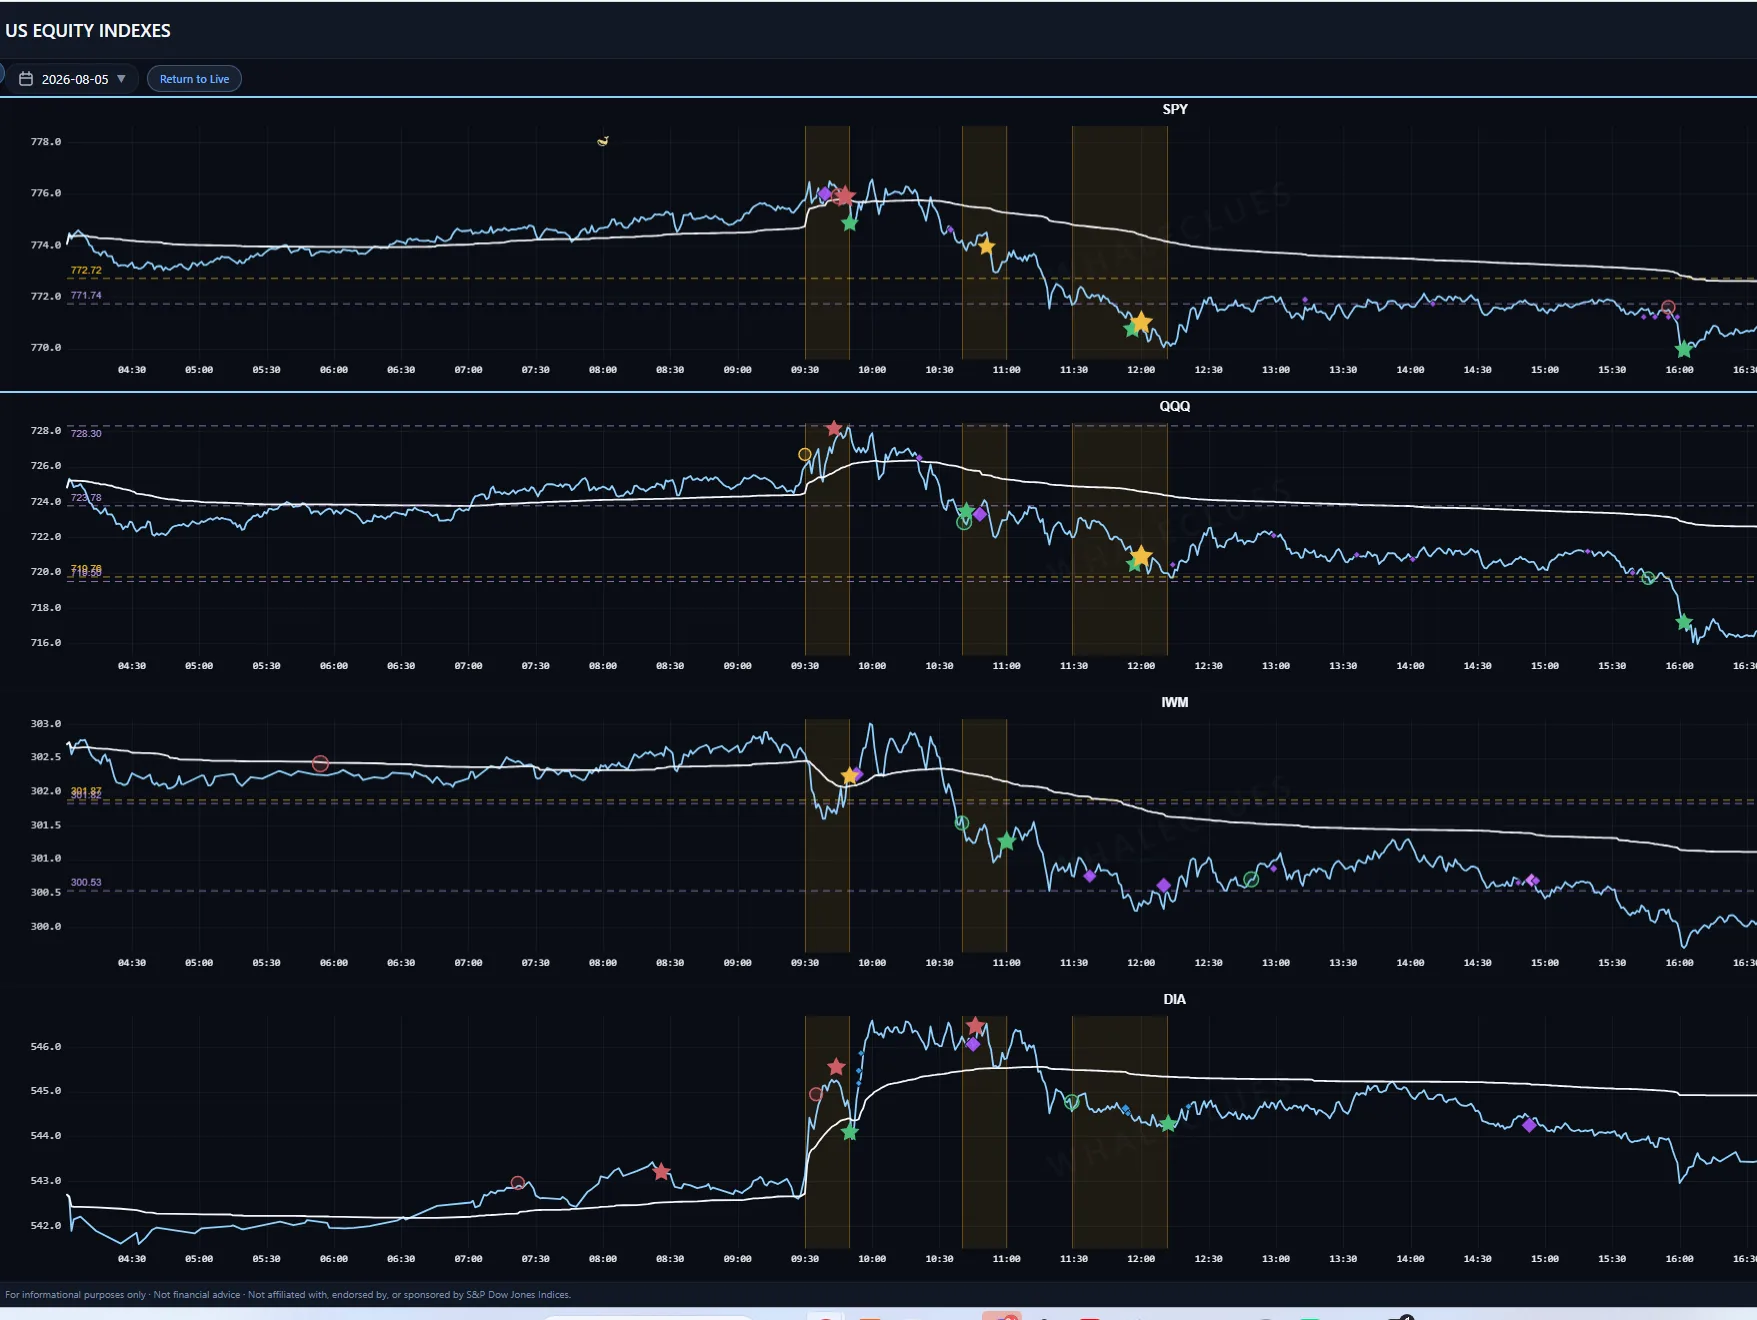
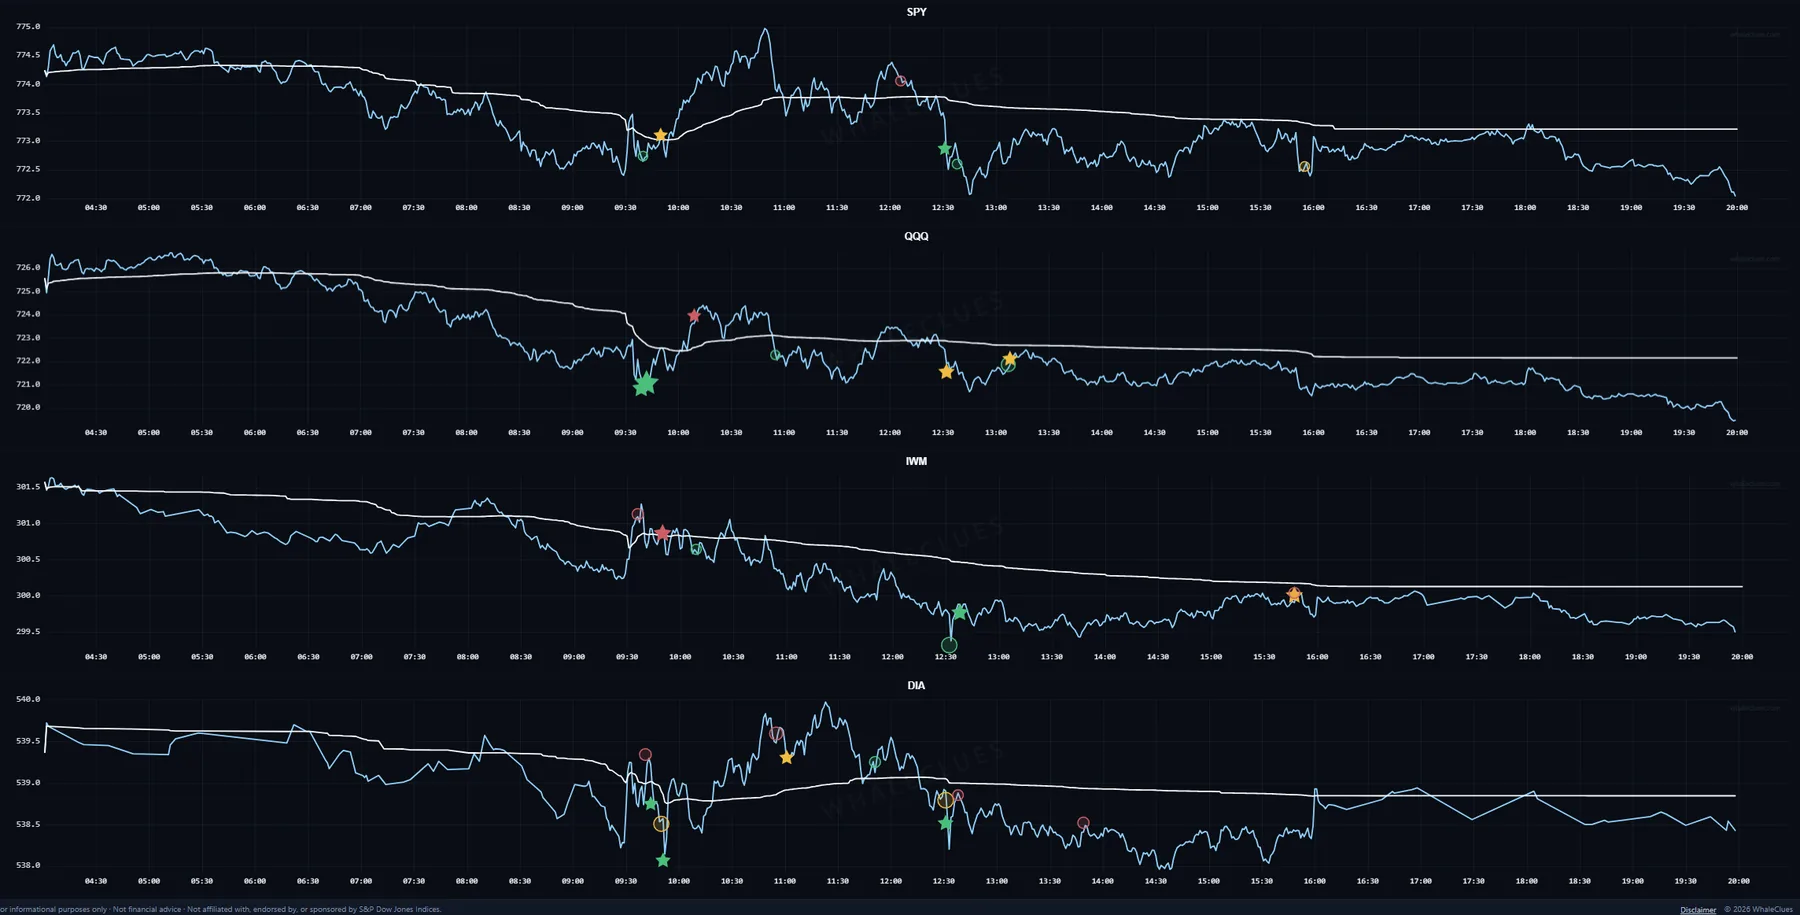
When you've subscribed to more than two of SPY, QQQ, IWM, DIA, all four panels render together so you can scan them as one cohesive group. Each panel runs its own markers, block prints and key levels — the shared time axis lets you spot resonance, divergence, and lead/lag at a glance.
The chart marks the strongest of those moments itself. When several of the four print Stars, Circles or Suns close together, a shaded time-band — resonance shading — appears across the participating panels, and a RESONANCE line lands in the alert feed naming the instruments and the shapes (never a direction). The band is drawn with a full-group subscription — all four index ETFs — and shows on historical dates too.
The shade records what price actually did after those signals — not what the signals themselves said: blue when the move that followed was net upward, pink when it was net downward, amber when it cancelled out. Because it reads what happened afterwards, a live band starts amber and settles into its colour as the move plays out — it is a record of what happened, not a forecast of which way price goes. What a resonance most clearly does is amplify volatility: once one forms, moves tend to be larger than usual, and the more instruments ring together the larger they tend to be. Which way is yours to read.
Every level on this page is live right now.
Reading about a VC Line is one thing; watching price stall against today's is another. The same markers, block prints and key levels described above are drawn on the live SPY, QQQ, IWM, DIA, GLD and SLV charts.