The Sun
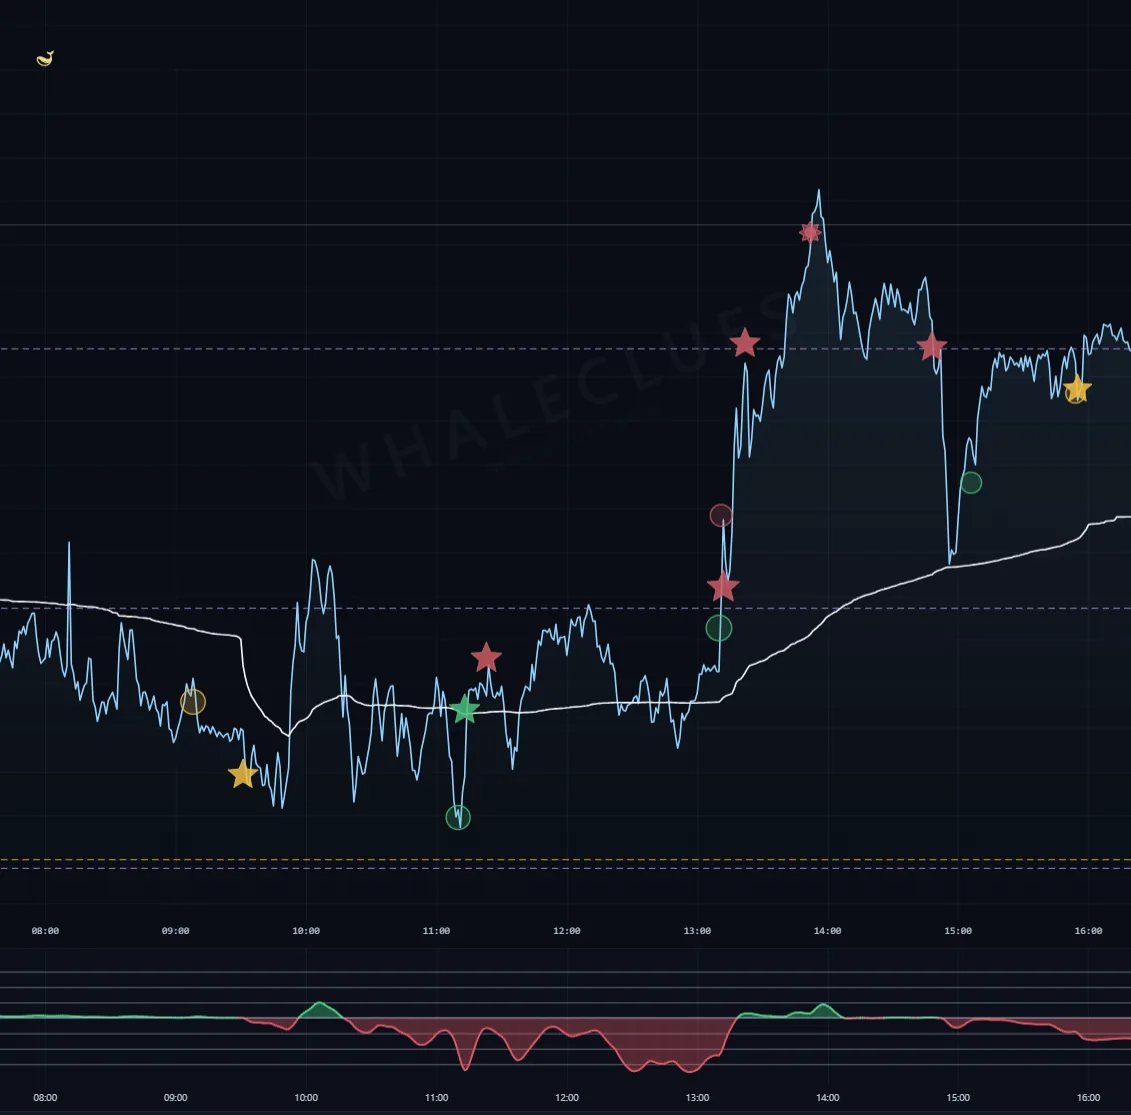
A Sun flags the trend running out of fuel — momentum is draining or already spent, so price is at or nearing a local extreme. A red Sun marks price at or approaching a local high; a green Sun, a local low. It is a heads-up that the current push may be near its limit — the move can pause, roll over, or, once the exhaustion clears, resume.
The Sun is most useful to read in confluence. When it appears together with Circles and Stars at the same area — or lines up with a key level below — a stall or turn at that local extreme shows up more often on the chart. A lone Sun is a caution flag; a Sun + Circle + Star stacked at one level is among the overlaps the tool highlights — still not a buy or sell.
Every level on this page is live right now.
Reading about a VC Line is one thing; watching price stall against today's is another. The same markers, block prints and key levels described above are drawn on the live SPY, QQQ, IWM, DIA, GLD and SLV charts.