Trading Tips
Single markers print all day long. The overlaps that more often coincide with a turn share one trait: confluence — a way to read the chart, not a strategy to follow. The two patterns below are where multiple markers line up.
Cross-instrument resonance
The four equity-index ETFs · SPY, QQQ, IWM, DIA · are driven by the same macro flow. When Stars, Circles, or Suns print on several of them at the same time and against the same structure (for example all tagging a recent high or a VC Line together), that stack is usually more interesting to watch than the same marker on a single instrument. Alignment across instruments is context — not a trade. The group views now draw this read for you: a shaded resonance band spans the panels that fired together, with a matching RESONANCE line in the alert feed. Its colour is a vote across those instruments’ own markers, nothing more; what the band reliably says is that the next hour tends to move wider than usual.
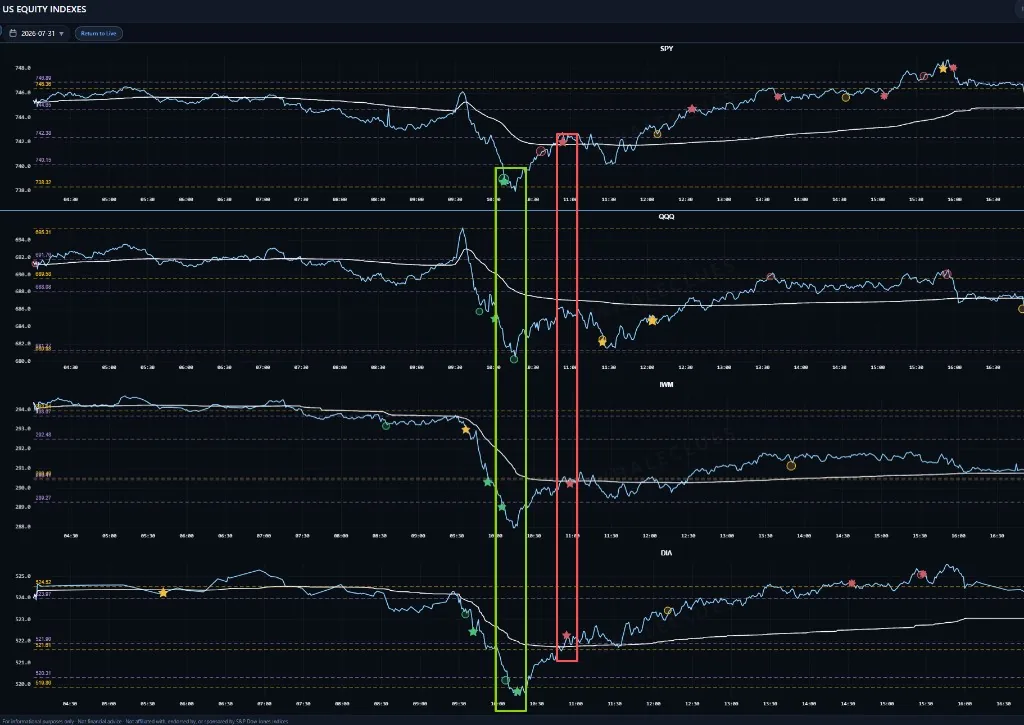
Multi-signal confluence at a level
Different marker types stacking at the same price. Watch for combinations like a Star or Circle firing right at a VC Line or S/R level; markers (Stars / Circles / Suns) clustering at the same price; or a Star overlapping with a Sun at a recent extreme. When two or three types flag the same price, the overlap is clearer on the chart — not a sharper trade to take.
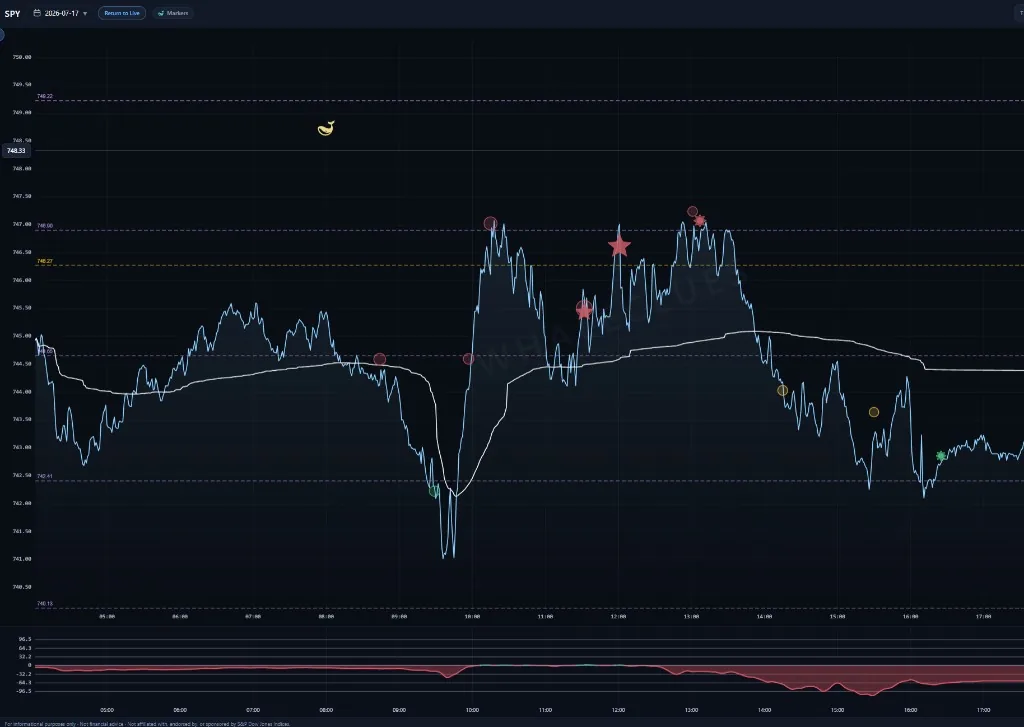
Going deeper on this: how order flow and gamma confluence actually stack — which signal families count as independent, the two patterns above in detail, and the three ways confluence misleads you.
Every level on this page is live right now.
Reading about a VC Line is one thing; watching price stall against today's is another. The same markers, block prints and key levels described above are drawn on the live SPY, QQQ, IWM, DIA, GLD and SLV charts.