Whale Trades
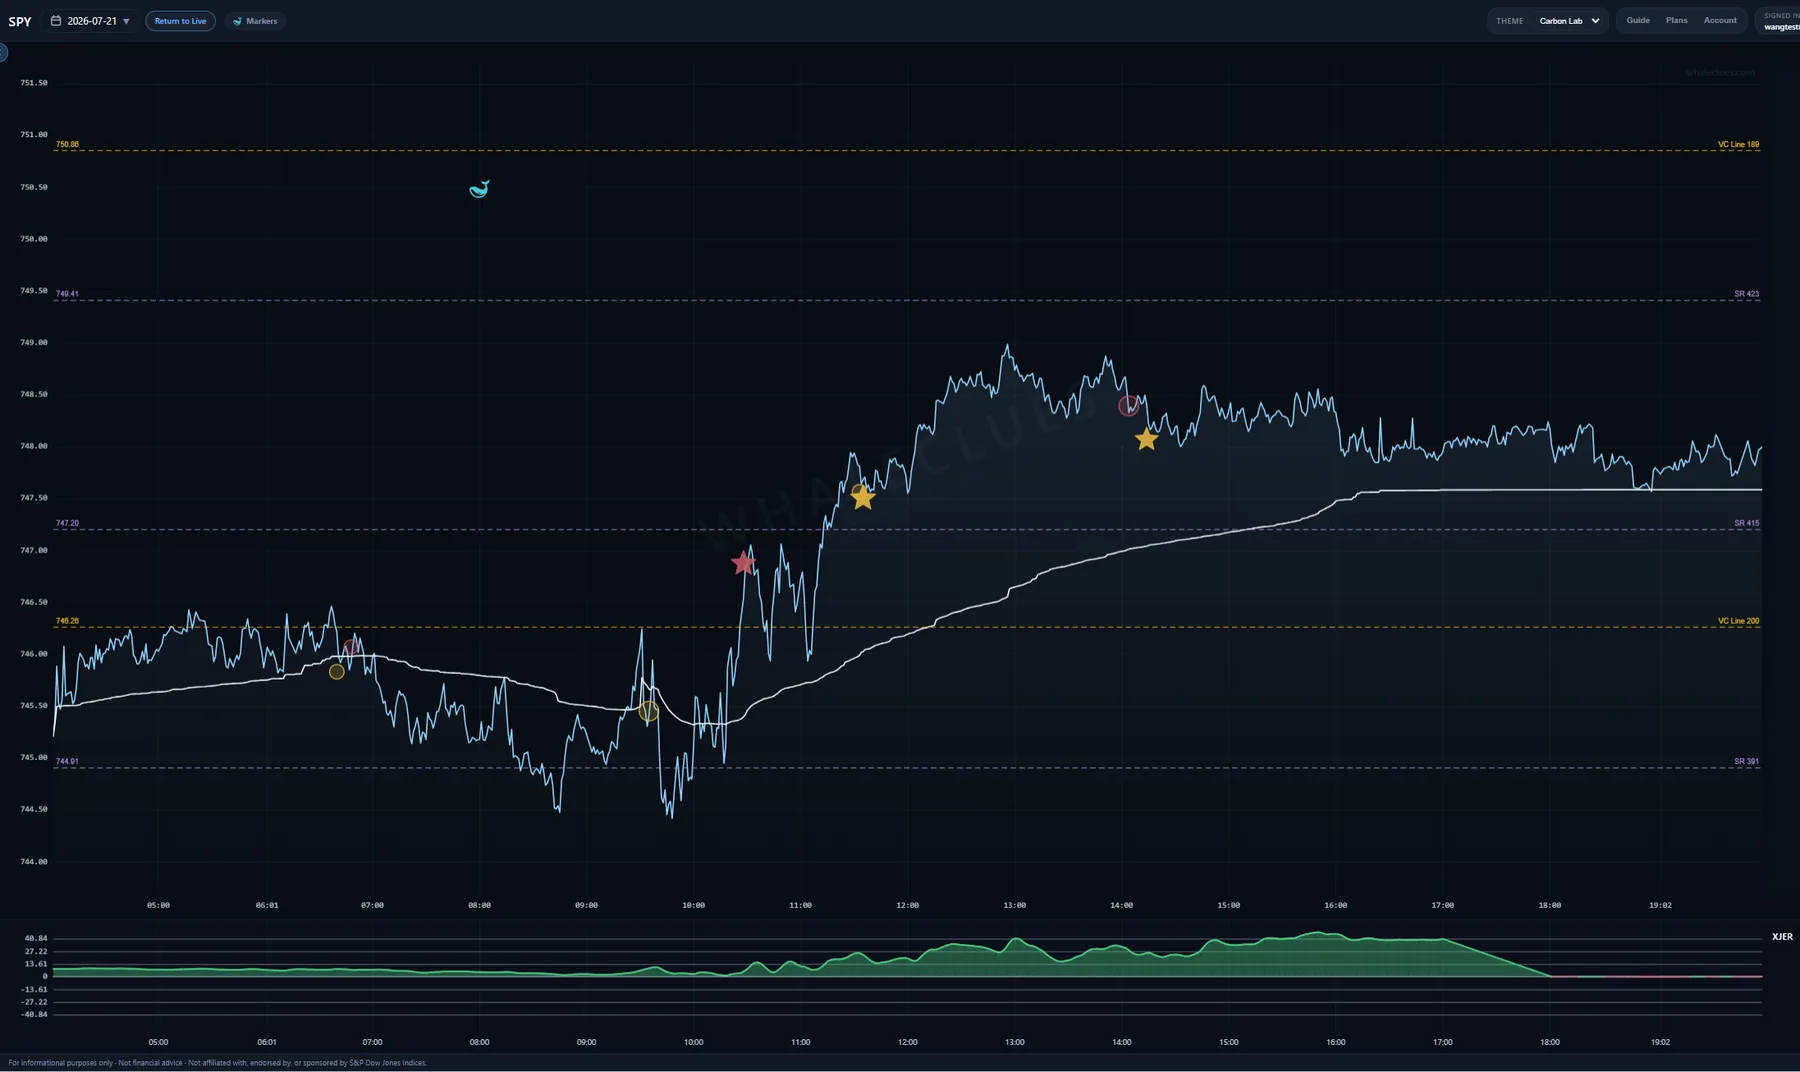
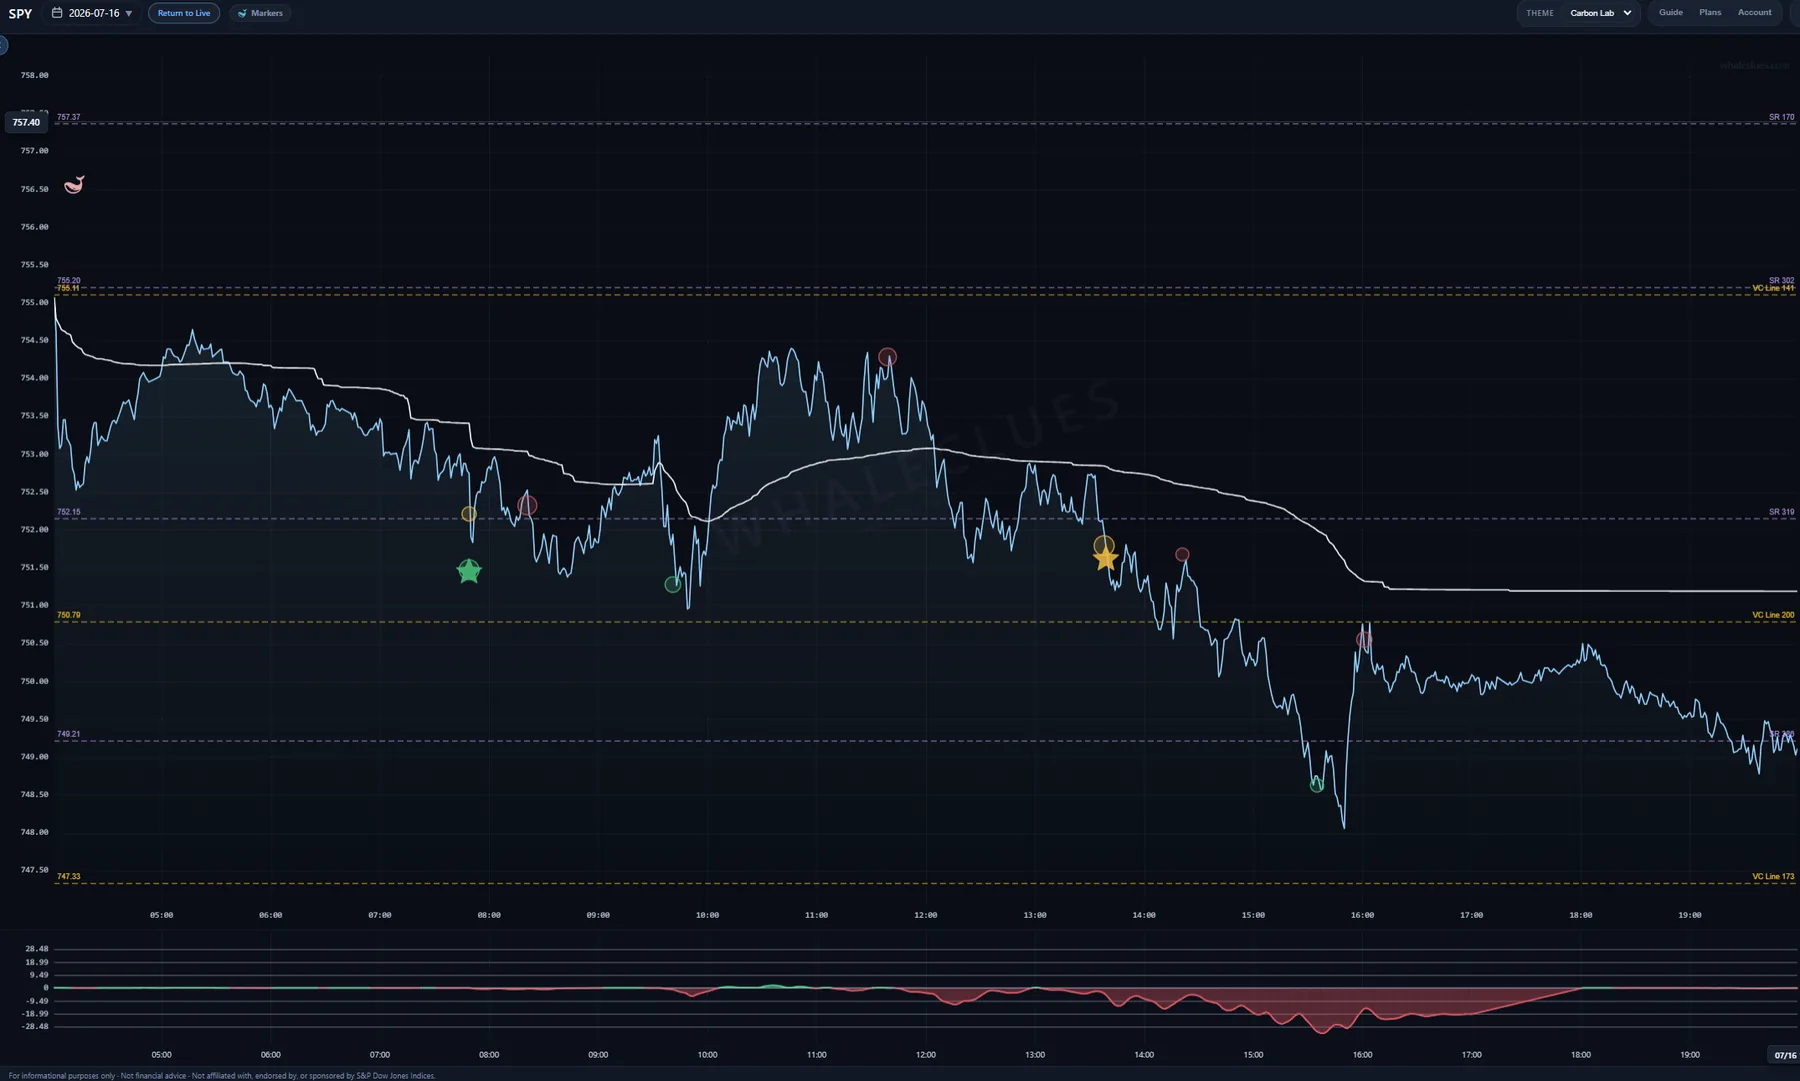
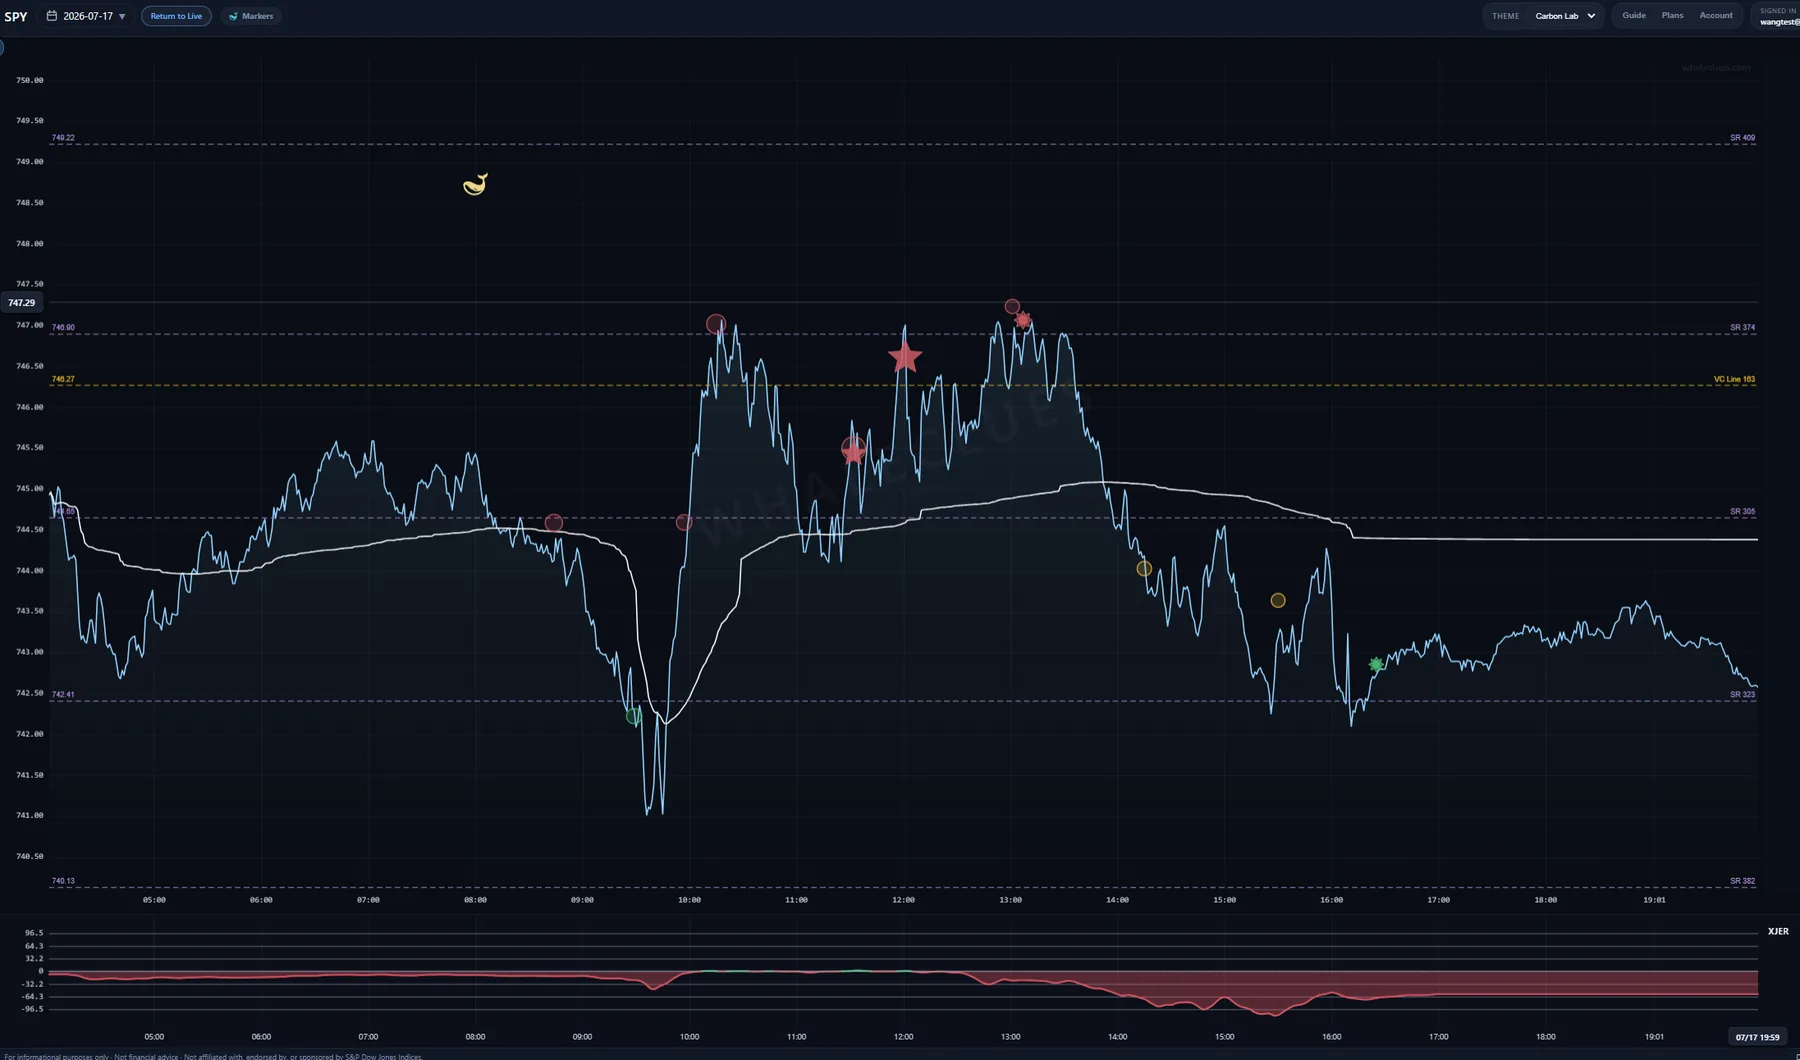
A Whale marks a session where flow is concentrated — often an early heads-up that volatility is elevated, not a forecast of direction. The color shows which side’s power dominates the flow behind the marker; when neither side dominates, the whale is drawn yellow.
Blue = buy-side power is dominant in the flow behind the marker. Pink = sell-side power is dominant. Yellow = neither side dominates — the balance is undetermined, and the move could develop either way.
Three sessions, one marker each, so the colour can be read against what followed. The whale prints early — well before the move — which is what makes it a heads-up rather than a confirmation.
Every level on this page is live right now.
Reading about a VC Line is one thing; watching price stall against today's is another. The same markers, block prints and key levels described above are drawn on the live SPY, QQQ, IWM, DIA, GLD and SLV charts.