Before You Believe a Reversal Story
Scope: a methodology note — what a fair test of these two claims requires. It asserts neither claim in either direction; the measured versions it specifies are published separately and linked here.
The two most-repeated reversal narratives in day trading — "they swept the stops and reversed" and "it's too far from VWAP, it has to come back" — share one defect: they are almost always told without the one ingredient that could test them, a control group. Both are testable claims. This note sets out what each claim actually asserts, what a fair test requires, and the questions to ask before believing either — including from us, when we publish the measured versions.
What does the stop-hunt story actually claim?#
More than it appears to. The familiar sequence — short at yesterday's high, stopped just above it, price falls — arrives with an explanation attached: "they took the liquidity and reversed." Unpacked, that one sentence asserts five things: stops existed near the level; they contributed to the move; some participant knew where they were; that participant pushed price through them deliberately; and profited from the reversal. Only the first is even visible on a chart. The event — price trading through a prior visible level — is observable. The intent is not, and the reversal that follows sometimes is doing all of the persuading.
The testable core survives without any intent: does price behave differently after breaking an obvious reference level than after an equally large move that broke nothing? That is answerable — but only with discipline about definitions.
What does the VWAP-magnet story claim?#
That distance alone predicts return. "Too far from VWAP" sounds quantitative and usually is not: too far measured how — in dollars, in percent, in units of that day's volatility? A move that is extreme on a quiet range day is routine on a trend day, so raw distance is not comparable across sessions; it has to be normalized by volatility before two "extended" readings mean the same thing. And "it came back" needs a definition with the same rigor: partial retracement, a touch of VWAP, an overshoot through it, and further extension are four different outcomes that the story compresses into "reverted" whenever any pullback occurs.
The honest reformulation is again conditional: given a normalized distance, what is the distribution of what happens next — and does that distribution differ from ordinary moves of the same size?
Why do both stories need a control group?#
Because markets retrace constantly, and a claim about levels is only informative relative to that base rate. Suppose 65% of prior-high breaks eventually reverse. Convincing — until you learn that 64% of same-sized moves that broke nothing also reversed, at which point the level added one percentage point of information and the story added the rest. Without the matched comparison — same move size, same volatility, same time of day, no level involved — a reversal statistic mostly measures how often markets pull back, which was never in question.
The same logic runs for VWAP: if everything stretched eventually snaps back somewhat, "it was 2σ out and it came back" tells you about markets, not about VWAP.
What makes such a test fair?#
Four requirements, and they generalize past these two stories:
| Requirement | What it prevents |
|---|---|
| Define the event before the outcome | Finding the reversal first, then calling the prior high a "sweep" |
| Fix the level list in advance (prior high/low, overnight high/low, predefined swings) | Levels nominated after the fact because a reversal happened there |
| Measure the full path at fixed horizons — continuation, re-entry, reversal, time-to-reversal | Screenshots standing in for distributions |
| Compare against distance-matched non-level moves, split by regime | Volatility and trend days doing the work the level gets credit for |
The regime split matters most for the VWAP claim: on a range day, fading extensions looks brilliant; on a trend day, the same trade is run over repeatedly at +1σ, +2σ, +3σ. If the reversion effect exists only inside one regime, that is the finding — a probability curve that changes shape with conditions is more useful than a slogan, and more honest than either story.
What are the possible answers?#
Three, and each would change behavior differently. Level breaks might reverse more often than controls — then the level carries information and "break plus rejection" earns study, though it still would not prove anyone hunted anything. They might continue more often — then reflexively fading sweeps is fighting the tape, and the popular story has the sign backward. Or the difference might vanish once volatility and regime are matched — then the entire effect was ordinary variance being remembered selectively, because stopped-out reversals sting and breakouts that ran are forgotten. Measured since, on SPY: the third — see the level-break test.
Nothing in this note asserts which answer is true. The measured versions — event definitions fixed in advance, controls and regime splits as specified here — are now published: the level-break test found the sweep-and-return shape occurring just as often behind ordinary moves that broke nothing, and the VWAP test found reversion running below chance at ordinary distances, with a real magnet only in the extreme tail. In both cases the base rate carried nearly everything the story had claimed for itself — which is the reason to ask for it first. The simplest base rate of all follows here.
Where does the close actually land, relative to VWAP?#
One base rate can be published now, because it needs no event definition at all: the unconditional distance between the regular-session close and that day's session VWAP. If price were meaningfully magnetized to VWAP by the end of the day, closes would cluster tightly around it. They do not. The median close lands 0.176% away from session VWAP on SPY and 0.361% away on SLV, with the other four funds in between — and on SPY, roughly one session in ten closes more than 0.5% away. The ordering across the six funds tracks each instrument's volatility, which is the point this note keeps returning to: raw distance from VWAP means nothing until it is normalized by what is normal for that instrument on that kind of day.
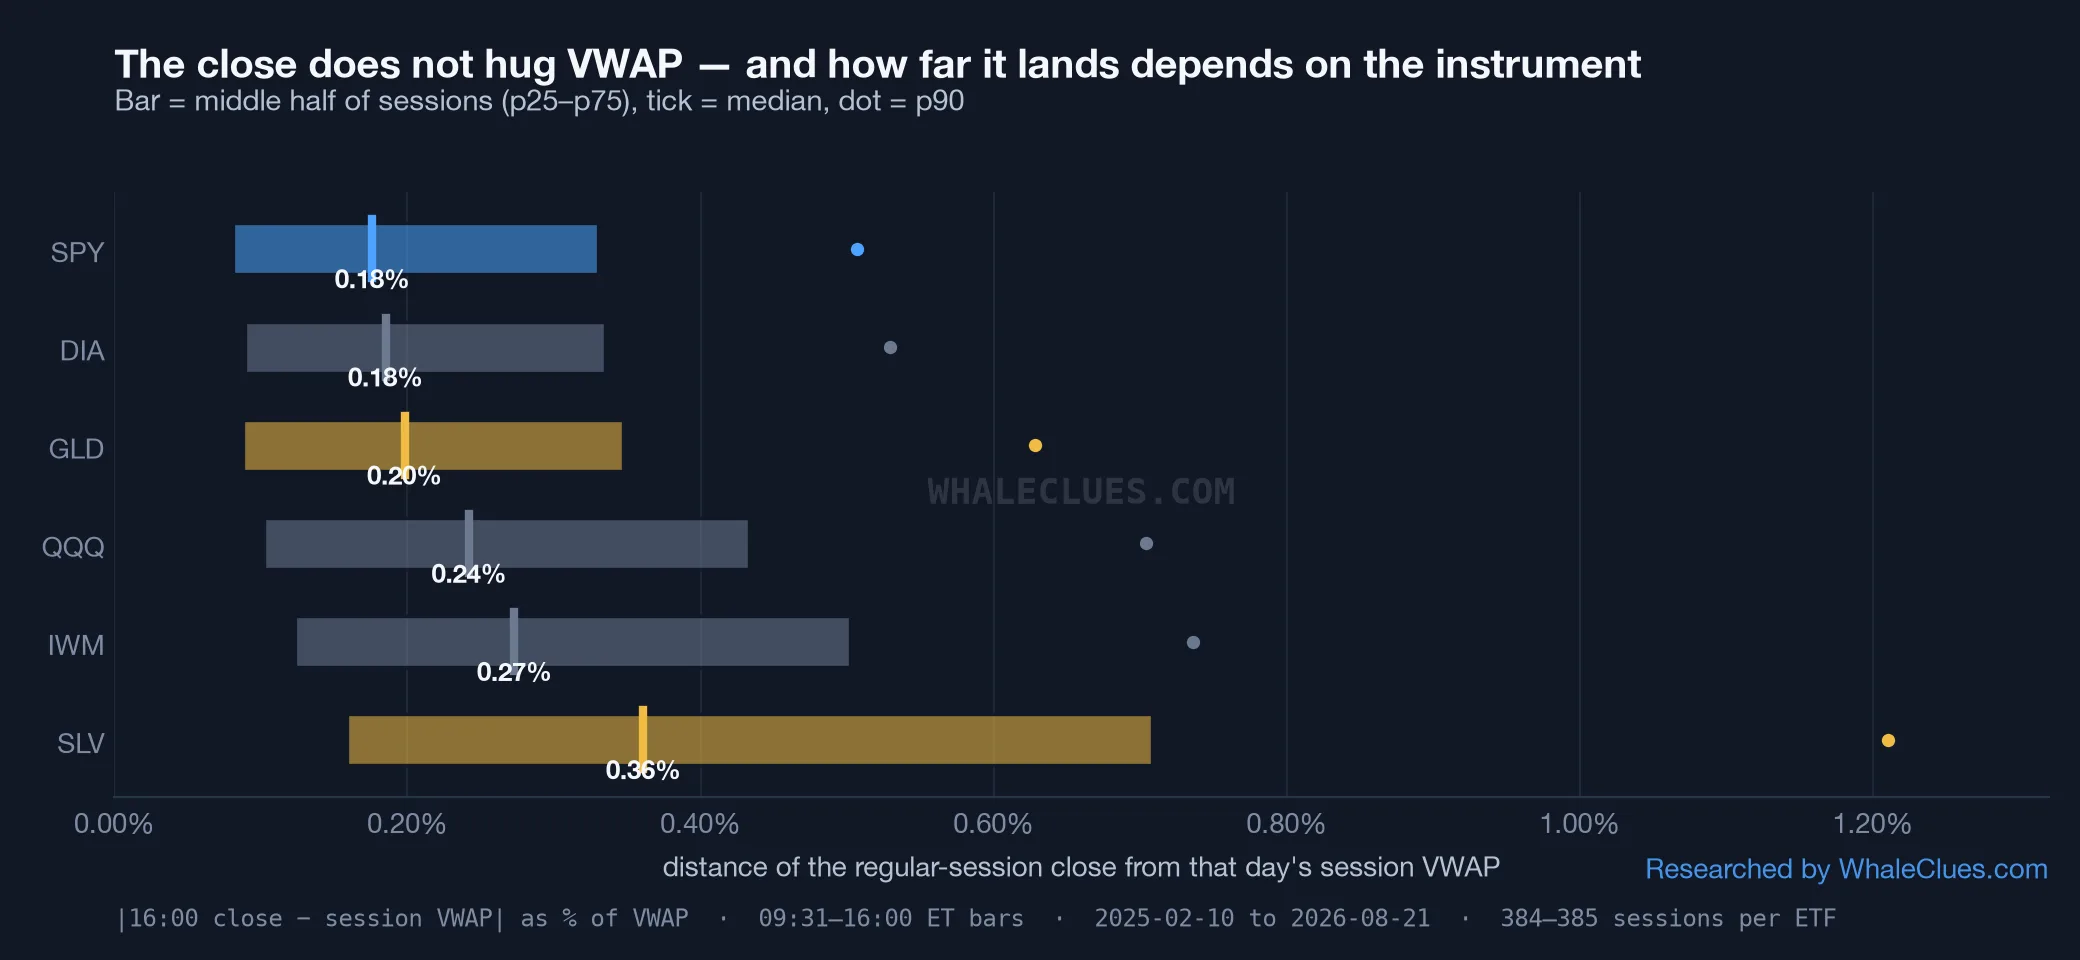
To be precise about what this is: a base rate, not a test of the magnet claim. It says nothing about intraday touches, retracement after an extension, or any conditional behaviour — those need the event definitions and controls described above, and are measured in the two notes linked from them. What it does do is set the "compared to what" for every end-of-day version of the story: a close 0.3% from VWAP is not evidence of a failed magnet or a successful one. It is Tuesday.
What changes tomorrow#
When the next "liquidity grab" or "VWAP snap-back" crosses your feed, ask the two questions this note is built on: compared to what? — and was the event defined before the outcome was known? Most stories dissolve at the first question. The ones that survive both are the ones worth your attention.
Related reading#
- The stop-hunt pattern is real. The edge is not. — this note's rules, applied to level breaks and wick sweeps.
- Does price really snap back to VWAP? — the same, applied to the VWAP magnet.
- The calendar effects are real and still useless — a claim taken through exactly this kind of test, control group included.
- Do SPY and QQQ move together? — what a measured claim looks like when the definition is fixed first and the caveats are stated with the number.
- The market does not know your P&L — the same demand for a base rate, turned on the trader's own record instead of the chart's.
See these levels on a live chart
Whale-sized prints, XJER and key levels on one order-flow chart.