Best Time of Day to Buy an ETF: Where the Volume Is
Scope: measured on the ETFs listed (SPY, QQQ, IWM, DIA, GLD, SLV). Findings apply to the instruments measured and do not automatically transfer to other markets.
SPY's busiest hour of the day carries 2.21× the volume of its quietest one — 22.72% of the session against 10.29% — and the busy one is the last. That is the closest thing to an answer this question has: not a window where buying works better, but a window where more shares are changing hands, so your own order is a smaller fraction of them.
Be clear about what that is and is not. This page measures volume — shares traded. It does not measure the spread you pay or the depth of the order book, which are what actually decide your fill. They usually move with volume, and they are not the same thing. Where they come apart is exactly where people get hurt, and the last section says what this data cannot tell you about that.
Is the open the worst time to buy?#
The open is the least settled part of the day. Whether that makes it a worse time to buy is a question about the spread, and this page does not measure the spread.
What it does measure is how far price travels. Across 401 full SPY sessions, 09:30–09:44 ranged a median 0.253% from high to low. A midday quarter hour ranged 0.132% (the mean of the eight fifteen-minute medians from 12:00 to 13:59), so the opening fifteen minutes travel 1.91× as far. QQQ, IWM, DIA, GLD and SLV run 2.25× to 2.84×. Split the window at December 2025, its midpoint, and all six still clear 1.7× in each half.
The median hides the mornings people remember. One SPY session in ten ranged more than 0.507% in those first fifteen minutes, against 0.317% for the same tenth of a midday quarter hour. Days with an 08:30 release such as CPI are the obvious suspects for that tail; this page does not split them out.
A wide range is movement in both directions, not a loss. An order sent at 09:31 meets a price that is still moving fast, and it can move for you as easily as against you.
At the other end of the day, SPY's last fifteen minutes before the closing auction carry 11.37% of the regular session's volume, the most of any quarter hour, with a range 1.30× midday's. Window for this section: 2025-02-10 to 2026-09-19, full sessions only. The hourly figures below end 2026-08-07.
The shape of the session is not the same for every fund#
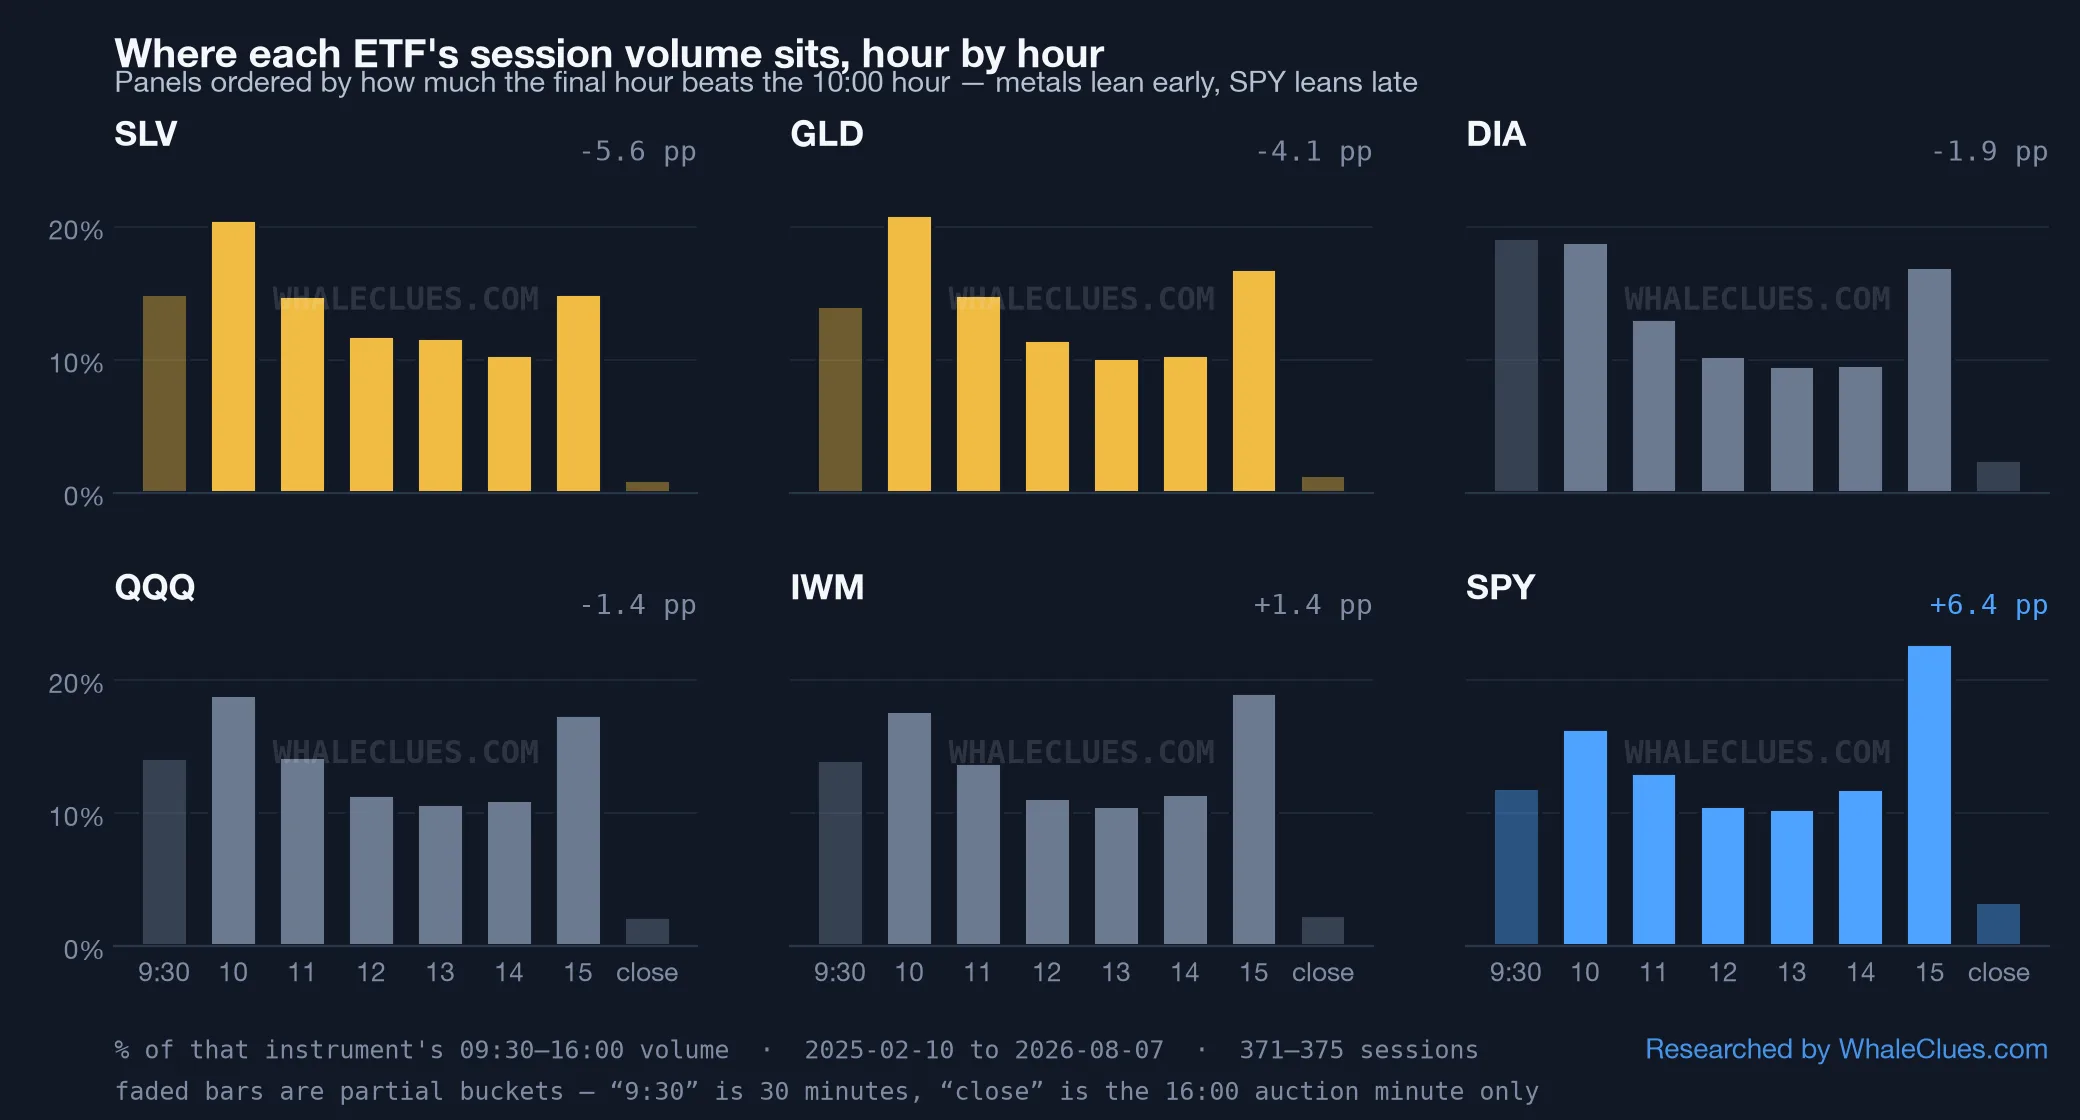
Ordered by how much the final hour beats the 10:00 hour, the six run from metals at one end to SPY at the other, and the mass visibly shifts rightward across the panels. SLV's 10:00 hour is 20.55% against 14.96% at 15:00; SPY's inverts to 16.36% and 22.72%.
Six hand-picked instruments sorted by a number will always form a line, so the ordering alone proves nothing. What makes it worth stating is that the trough does not move: five of the six are quietest in the 13:00 hour, the sixth in the 14:00 hour, regardless of which end of the split they sit on. The peak is fund-specific; the midday hole is not.
A reading that fits: GLD and SLV track metals that London and Asia have been pricing for hours before New York opens, so the US session inherits a price rather than discovering one, and the flow arrives early. SPY's exposure is priced here, and the largest single liquidity event of its day is the closing auction. Other things differ too — fees, holders, the options ecosystem around each — so treat this as the reading that fits, not the only variable in play.
The busiest window is also the least protected one#
The Limit Up-Limit Down plan sets price bands around every NMS stock and ETP, and pauses trading when a quote runs into one. It says, verbatim:
"Price Bands are doubled during last 25 minutes of the regular trading day for all Tier 1 Securities and for Tier 2 Securities below $3.00."
— luldplan.com, read 14 August 2026.
So the final stretch of the day, where SPY does more than a fifth of its volume, is also where a price has twice as much room to run before anything stops it. That is deliberate and defensible: bands that are too tight into the close would trigger constantly during the auction build-up. But it means the two move in opposite directions at the same time: the crowd is at its largest and the guardrail is at its widest.
There is a second distinction worth knowing, and it is a real trap: the plan puts "all securities in the S&P 500, the Russell 1000 and select Exchange Traded Products" in Tier 1, and everything else in Tier 2 with wider bands. Not every ETF is Tier 1. Which ones are is not stated on that page, so we are not going to label any specific fund — but assuming your fund gets S&P-500-grade guardrails because it is an ETF is an assumption, not a fact.
What about the "power hour"?#
The retail folklore says the last hour is special. On volume, the folklore is right: SPY's 15:00 hour is 22.72% of the session and its 13:00 hour is 10.29%. We could not find a source that attaches a measurement to the claim, so here is one.
What the folklore adds to that is an edge, and there it goes quiet. Every source repeating it is another blog citing another blog; one of the larger ones concedes in writing that it is "no exact science". There is no sample, no window, no number to check. So the honest split is: the volume claim is true and now measured; the edge claim has never been stated precisely enough to be wrong.
Nothing here is a reason to trade the close. More volume does not mean more edge — it means more people, which is a statement about execution cost, not about direction.
What this means for a single order#
If you are buying a position you intend to hold, the practical reading is short:
- The 09:30 bucket is half an hour long and still one of the busiest blocks on the page. That is the opening auction resolving overnight news rather than a settled market — a different kind of activity from the rest of the session, not simply more of it. Cut into quarter hours, its first fifteen minutes travel 1.91× as far as midday on SPY (measured above).
- Midday is the thinnest, and it is thin for everyone. The 13:00 hour is the trough on five of six. A large order there is a larger share of what is trading.
- The last hour has the most volume, and also the widest bands. Which of those matters more depends on your order size relative to what is trading, and this page cannot tell you that — it can only tell you the denominator.
- The busy end differs by fund: mornings for SLV and GLD, afternoons for SPY and IWM. A generalisation drawn from SPY does not describe a metals fund.
And the honest limit on all of it: this is about the cost of getting in, not about whether getting in is a good idea. Nothing on this page says any hour predicts a return.
What volume cannot tell you, and where that matters#
A reader who has been filled far from the price on his screen will not find the explanation here, and it is worth saying why rather than leaving him to assume this page covered it.
Three different things produce a bad fill, and volume speaks to only one:
- The spread. The gap between the best bid and the best offer. It widens when few people are quoting. This data does not measure it.
- The price you were looking at. A last-traded price is not a current quote. In a thin window the last trade can be minutes old, so the number on the screen was never available to you.
- Your own order. A large order relative to what is resting will walk up the book. Volume is a rough guide to how much is resting; it is not a measurement of it.
The first two are invisible in share counts, and they are the ones that bite outside the busy hours. Treat everything on this page as a statement about how many people are trading, and treat the spread as a separate question that needs separate data.
Limits#
- Volume is not depth, and it is not the spread. These are share counts. A busy hour is usually a cheaper hour to transact in, but this page never measured the cost — only the crowd.
- Averages across 371–375 sessions. A CPI print or an FOMC statement redistributes the whole curve for a day.
- Two buckets are not hours. The 09:30 column is thirty minutes and the close is a single auction minute; neither can be ranked against a full hour, which is why both are faded in the chart.
- Six US-listed instruments. Nothing here transfers automatically to a thinly traded fund, where the spread rather than the hour is the dominant cost.
The data#
- Volume by hour of the regular session — every bucket in the chart above, six ETFs, free to reuse with attribution.
- Volume by session segment — the pre-market and after-hours companion.
- Range and volume by quarter hour — median high-low range and volume share for all 26 fifteen-minute buckets, six ETFs, the numbers behind the open-versus-close comparison.
Each file carries its window, sample size and denominator in its header.
Related reading#
- Trading ETFs premarket and after hours — the same question outside 09:30–16:00, where the guardrails are off entirely.
- The calendar effects are real and still useless — the same discipline applied to days instead of hours.
- The overnight gap is mostly over before you see it — what has already happened to the price before the hour you choose.
See these levels on a live chart
Whale-sized prints, XJER and key levels on one order-flow chart.