The Overnight Gap Is Mostly Over Before You See It
Scope: measured on the ETFs listed (SPY, QQQ, IWM, DIA, GLD, SLV). Findings apply to the instruments measured and do not automatically transfer to other markets.
The gap you read off the open is not what happened overnight — it is what is left of it. Across 305 SPY sessions that opened more than 0.1% from the prior close, the very first pre-market print, at 04:01, was already a median of 60% of the way to the 09:30 open. On roughly a quarter of those sessions it had gone further than the open, and on one in six it had moved the other way first.
That first print did not get there by trading. It opened there: index futures and foreign markets price this exposure while New York sleeps, and the first ETF print of the day simply carries that result in. Everything the pre-market session then does happens on top of a gap that was largely set before it began.
Where the gap actually happened#
"Overnight gap" names a 17½-hour interval as if it were an instant. It is not: US-listed ETFs trade from 04:00, so by the time the pre-market session opens, most of the repricing has already been done somewhere else — futures, foreign markets, and the first prints of the extended session itself.
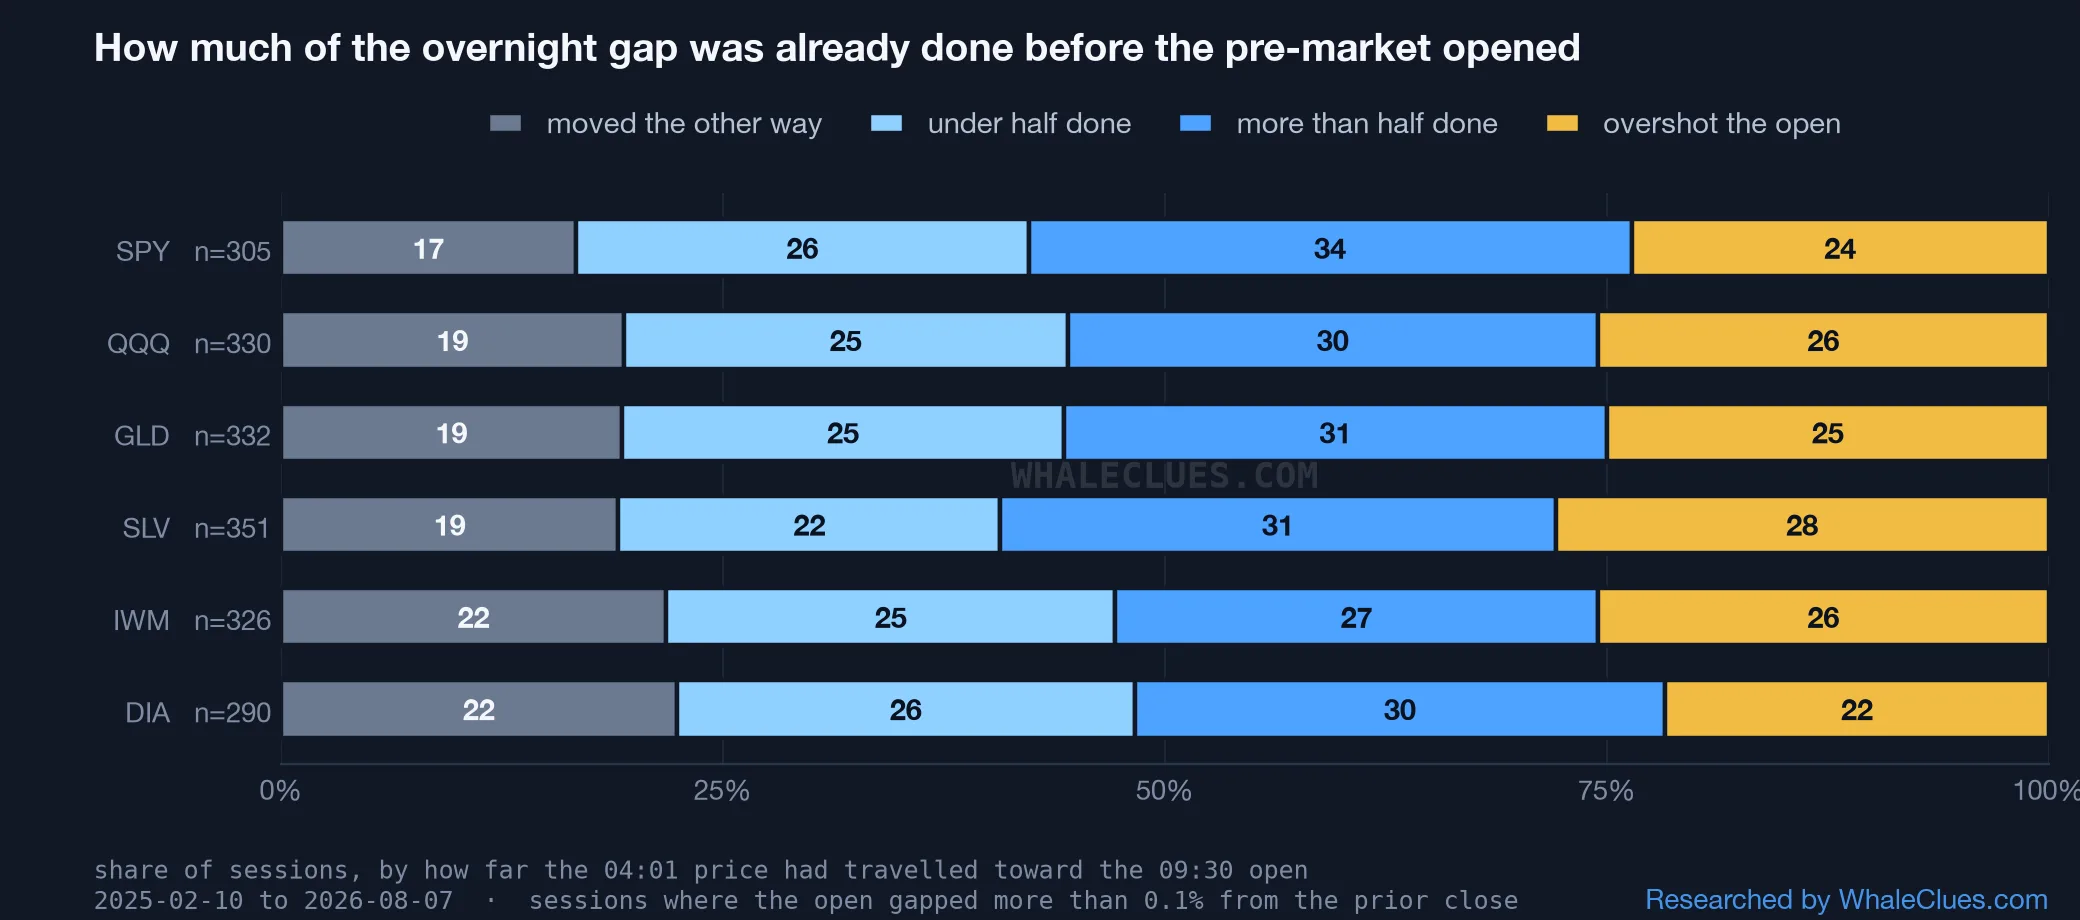
| ETF | Moved the other way | Under half done | More than half done | Overshot the open | Median share done |
|---|---|---|---|---|---|
| SPY | 16.7% | 25.6% | 34.1% | 23.6% | 60.2% |
| QQQ | 19.4% | 25.1% | 30.0% | 25.5% | 58.2% |
| GLD | 19.3% | 25.0% | 30.7% | 25.0% | 59.2% |
| SLV | 19.1% | 21.6% | 31.4% | 27.9% | 62.7% |
| IWM | 21.8% | 25.4% | 27.3% | 25.5% | 54.3% |
| DIA | 22.4% | 25.9% | 30.0% | 21.7% | 51.8% |
2025-02-10 to 2026-08-07, one-minute bars. A session qualifies when the 09:30 open sits more than 0.1% from the prior 16:00 close (n = 290–351 per instrument, out of 369–371 total sessions). "Share done" = (04:01 price − prior close) ÷ (09:30 open − prior close), so 100% means the first pre-market print was already at the opening price and a negative value means it was on the other side of the prior close.
The answer is the same for every instrument, and that is the useful part#
The previous note in this series found that the six ETFs have visibly different intraday shapes — metals busiest at 10:00, SPY in the closing hour. This measurement finds the opposite: the four segments land within a few points of each other on all six bars, and the median share done spans just 51.8% to 62.7%.
That sameness carries more weight than a spread would. A pattern that held only for SPY would be a fact about SPY. One that holds across two metals, three equity indices and a small-cap fund is a fact about how overnight repricing works, not about any instrument — and it is more likely to survive into the instruments not measured here.
What it means for the gap-fill statistics you have read#
Published gap-fill rates almost always define the gap as prior close → open, then measure whether price returns to the prior close during the session. Both ends of that definition are fine. The gap between them is where the problem sits: the statistic silently attributes 17½ hours of repricing to a single instant, and then measures a reaction to it.
To be precise about what does and does not follow: the fill still has to travel the whole distance back to the prior close, so knowing the gap was 60% done by 04:01 does not shrink it. What it changes is what the statistic is about. A fill rate is usually read as "the market corrects its overnight overreaction". But most of that move was priced hours earlier, in other markets, before the ETF printed once — so the session is not correcting its own excess. It is reacting to a repricing that finished somewhere else.
Can you actually act on the part you can see?#
Mostly not, and the numbers say so plainly. Pre-market volume is 2.34% of SPY's full day and 1.35% of DIA's; only the metals reach meaningful share (SLV 7.73%, GLD 4.69%). So the window in which the gap is still moving is also the window with the thinnest book — you are watching a price form in a market you cannot trade size in.
That is the practical shape of it: the information arrives before the liquidity does. For an investor holding through the close, the useful reading is not "how do I trade the gap" but "how much of tomorrow's opening move is already visible tonight" — and by 04:01 the answer is usually most of it.
What this does not say#
It does not say the pre-market predicts the open. One session in five moves the opposite way first, and a quarter overshoot — a 60% median is a central tendency wrapped in a wide distribution, not a rule.
It also cannot say where the repricing happened before 04:01, only that it had. Index futures trade nearly around the clock and foreign markets are open while New York sleeps; this measurement sees the result, not the venue.
One limit on the sample: sessions gapping less than 0.1% are excluded, because dividing by a near-zero gap produces meaningless ratios. That removes 5–21% of sessions per instrument, all of them the quietest ones.
A larger one: this is a single 18-month window, and a calm one by historical standards. March 2020 or 2022 might distribute overnight repricing very differently — a crisis reprices continuously rather than settling before dawn. The cross-instrument agreement here says the pattern is not an artefact of one fund; it does not say the pattern survives a different regime.
Related reading#
- Best time of day to buy an ETF — the hour-by-hour shape of the session, and where the book is deepest.
- Key levels on the chart
- Reading block prints
See these levels on a live chart
Whale-sized prints, XJER and key levels on one order-flow chart.