Can You Trade ETFs Premarket and After Hours?
Scope: measured on the ETFs listed (SPY, QQQ, IWM, DIA, GLD, SLV). Findings apply to the instruments measured and do not automatically transfer to other markets.
Two thirds of SPY's entire after-hours volume — 64.3% of it — arrives in the first fifteen minutes after the close. By 16:30 it is 84.9%, and the remaining three and a half hours share what is left. Yes, you can trade ETFs outside the regular session; every broker page will tell you that. What none of them tell you is how much is actually there, and the answer is not "a bit less" — it is a different market with a different shape, and the shape depends on which fund you hold.
The sessions, and what is switched off inside them#
Most US ETFs are primary-listed on NYSE Arca, which publishes its sessions: an Early Trading Session from 4:00 to 9:30 a.m. ET, Core Trading 9:30 a.m. to 4:00 p.m., and a Late Trading Session from 4:00 to 8:00 p.m. ET (source, read 14 August 2026). Sixteen hours available; six and a half of them are the regular session.
Two things about those extra hours are worth more than the hours themselves.
The circuit breakers are off. The Limit Up-Limit Down plan — the mechanism that stops a quote running away and pauses trading for five minutes when it does — states its own scope plainly: "The Plan applies during regular trading hours of 9:30 am ET - 4:00 pm ET" (source). Outside 09:30–16:00 there are no price bands and no volatility pauses. The protection most people assume is always watching is switched off precisely when the fewest people are trading.
Limit orders are your broker's rule, not the market's. FINRA Rule 2265 requires your broker to hand you an extended-hours risk disclosure before you can trade — lower liquidity, higher volatility, wider spreads, prices that may not match the next open. It does not require limit orders, and no SEC rule found does either. Most brokers impose that themselves. It is a good policy and you should use limit orders anyway; it is just not market structure, and a page that tells you it is has not checked.
Volume outside the session does not spread out — it arrives in bursts#
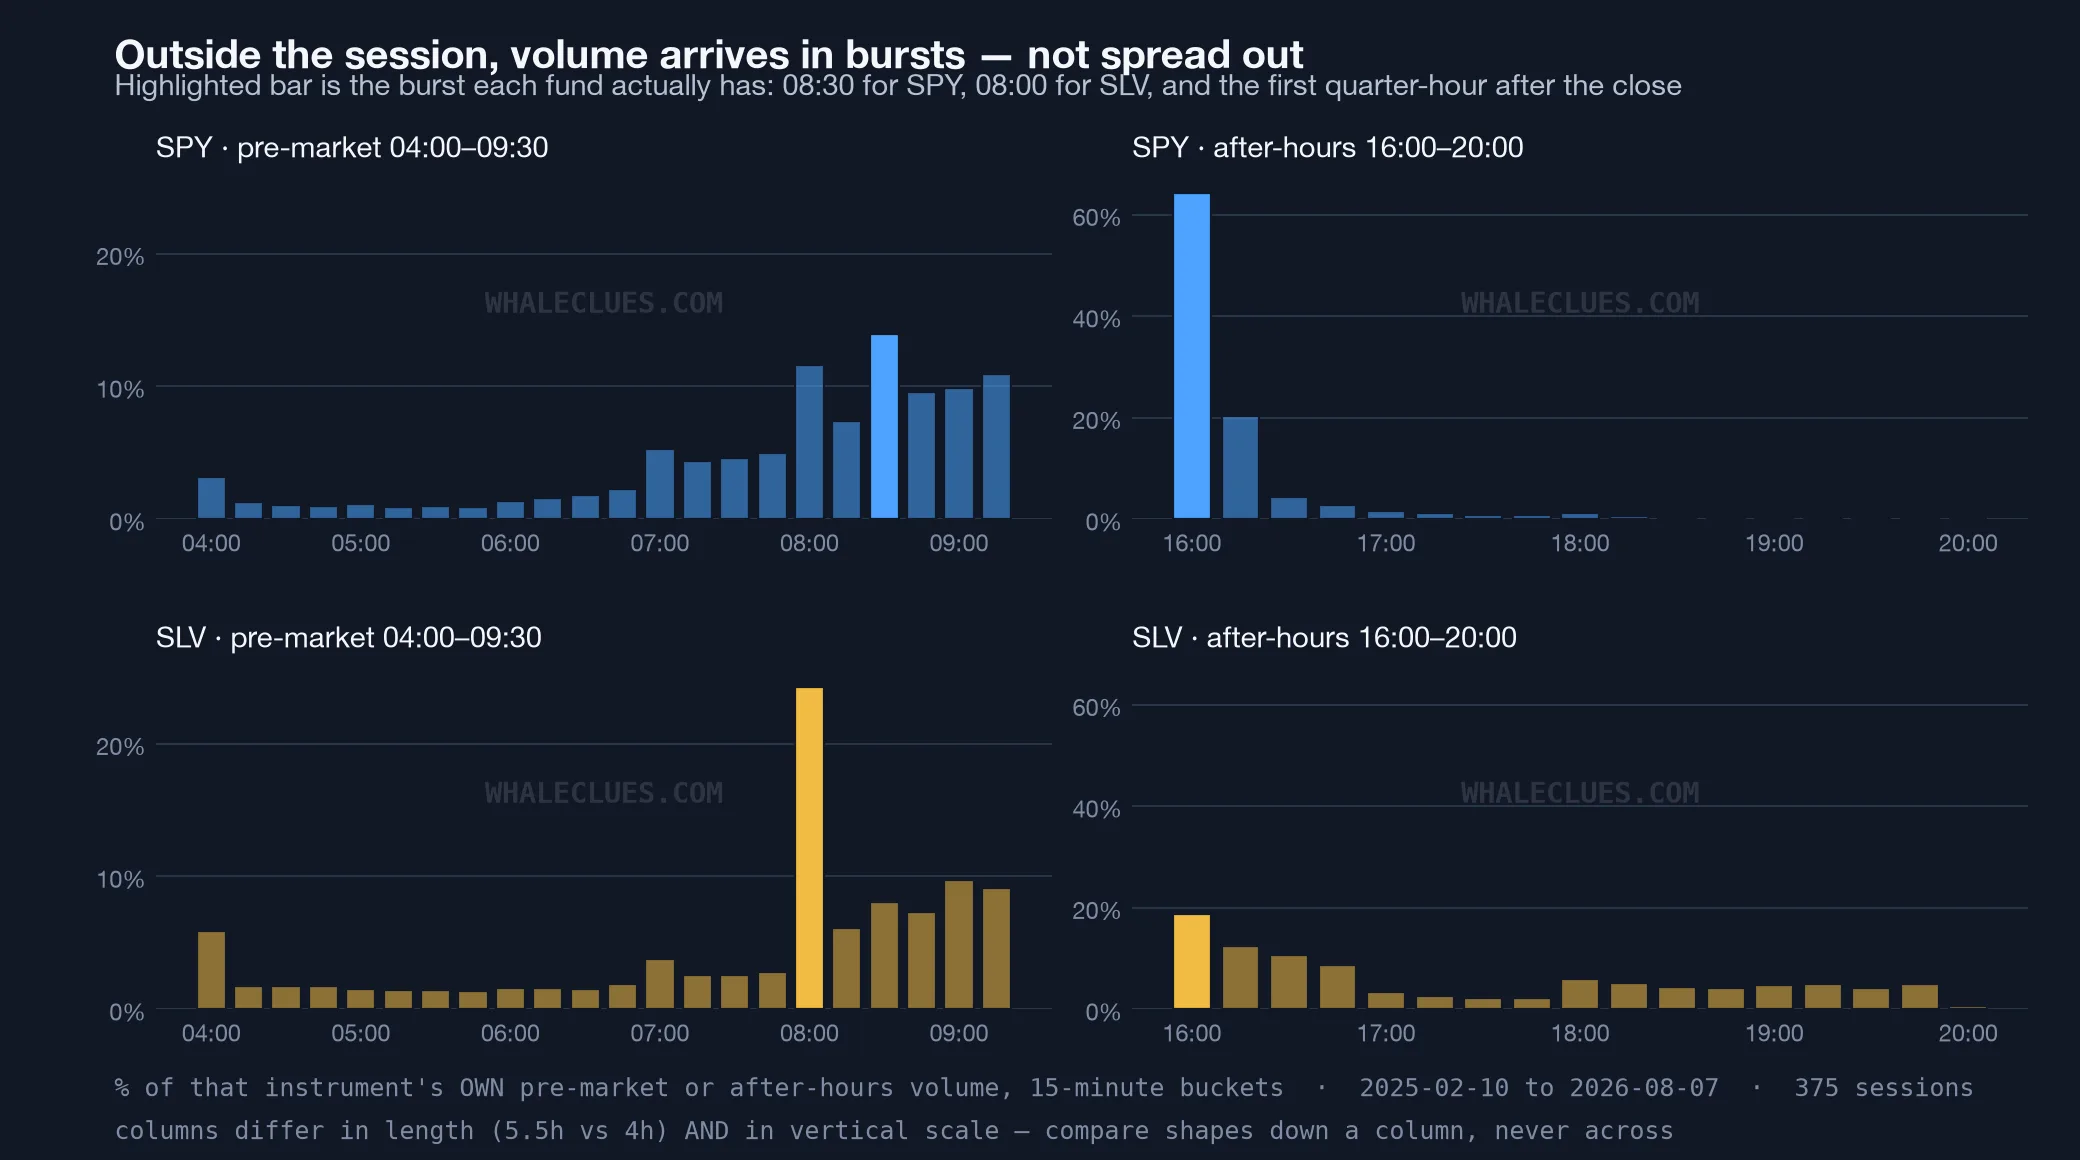
The after-hours session is the wake of the close, and how long the wake lasts depends on the fund. SPY: 84.9% inside thirty minutes. IWM 76.7%, QQQ 71.3%, DIA 63.6%, GLD 51.4%. SLV: 31.9% — for silver the evening is not a residue, it is most of the session.
The pre-market is the more interesting half, because it is where the naive expectation fails: it is not a slow ramp toward the opening bell. The final half hour before the open carries only about a fifth of it — 20.8% for SPY, 18.9% for SLV, every one of the six between 18.9% and 21.9%. The volume is elsewhere, and where differs by fund:
- Equity ETFs bunch at 08:30, the US macroeconomic release slot. The single minute containing the release is 2.16% of SPY's whole pre-market, four times its neighbouring minutes.
- Metals bunch at 08:00, half an hour earlier and much harder. On a typical day the 08:00–08:15 quarter hour alone is 20.6% of SLV's whole pre-market; for GLD, 17.8%.
Every percentage in those two lines is a share of that fund's own pre-market volume, and the same denominator makes the two bursts comparable — which turns out to matter, because they are not the same kind of event.
Take the 08:00–08:15 and 08:30–08:45 quarter hours and ask each one twice: what share of pre-market volume does it hold on a typical day, and what share does it hold when you pool every day together? A gap between those two answers means a few days are doing the work.
| Quarter hour, as a share of that fund's pre-market | typical day | all days pooled |
|---|---|---|
| SPY, 08:30–08:45 | 9.6% | 13.9% |
| SLV, 08:00–08:15 | 20.6% | 24.3% |
SPY's release window is half again as large once the days are pooled — the signature of something that happens on some days and drags the average up, which is what a release calendar looks like. SLV's 08:00 window barely moves, so it is a feature of ordinary days.
Why 08:00 matters to metals we cannot tell you. Volume data says when, never why, and a plausible story is not a finding. It is a real, repeatable feature of the tape and we are declining to explain it rather than guessing.
What this changes if you are placing an order#
Outside the session the useful question is not whether you can trade — you can — but how many other people are trading at that moment, because your own order is measured against theirs. What follows is about that crowd. It is not about the spread you will pay, which is a different measurement and not one this data contains.
For SPY, the after-hours crowd is essentially a half-hour phenomenon: 84.9% of it is present by 16:30, and everything after 18:00 accounts for 4.0% of the session — with no price bands operating underneath it. For a metals ETF the arithmetic is different. 39.1% of SLV's after-hours volume arrives after 18:00, nearly ten times SPY's share, and it arrives at a steady four to six per cent per quarter hour rather than in a burst. The evening is not a residue there.
In the morning, the corresponding fact is that most of the pre-market has not happened yet before 08:30. That is not a quiet market; it is a nearly empty one.
None of this says the pre-market or the after-hours session predicts anything. It says where the participation is. A price set by a handful of prints and a price set by thousands look identical afterwards.
Limits#
- Volume is not depth and it is not the spread. These are counts of shares traded. How much you actually pay is set by the spread and by what is resting on the book, neither of which is measured here.
- The two sessions are different lengths, so compare them with care. Spread evenly, the first thirty minutes would be 12.5% of the after-hours session and the final thirty 9.1% of the pre-market. SPY's 84.9% is 6.8× an even spread; its pre-market 20.8% is 2.3×. The asymmetry survives that correction, but the raw figures overstate it.
- Averages across 375 sessions. Any individual day can look nothing like this, and the 08:30 figure in particular is an average over days that mostly had no release — the effect on an actual release day is larger than the number here, and this measurement cannot say by how much.
- Six instruments, US-listed. SPY, QQQ, IWM, DIA, GLD, SLV. Nothing here transfers automatically to a thinly traded fund, which is where extended-hours risk is greatest.
- Session times change. They were read from the exchange's live page on the date this note was published; a further extension of Arca's sessions has been approved. Check the link.
The data#
Both datasets behind this note are downloadable, free to reuse with attribution:
- Volume by session segment — pre / session / post shares and the sub-buckets above, six ETFs.
- Volume by hour of the regular session — the intraday companion.
Each file carries its window, sample size and denominator definitions in its header, because a number quoted without them is worse than no number.
Related reading#
- Best time of day to buy ETFs — the same question inside the regular session, hour by hour.
- The overnight gap is mostly over before you see it — what the pre-market has already done to the price by the time you see the open.
- Futures trading hours — the market that stays open while this one is shut.
See these levels on a live chart
Whale-sized prints, XJER and key levels on one order-flow chart.