How Much Does SPY Move in a Day? Average Daily Range and ATR
Scope: measured on the ETFs listed (SPY, QQQ, IWM, DIA, GLD, SLV). Findings apply to the instruments measured and do not automatically transfer to other markets.
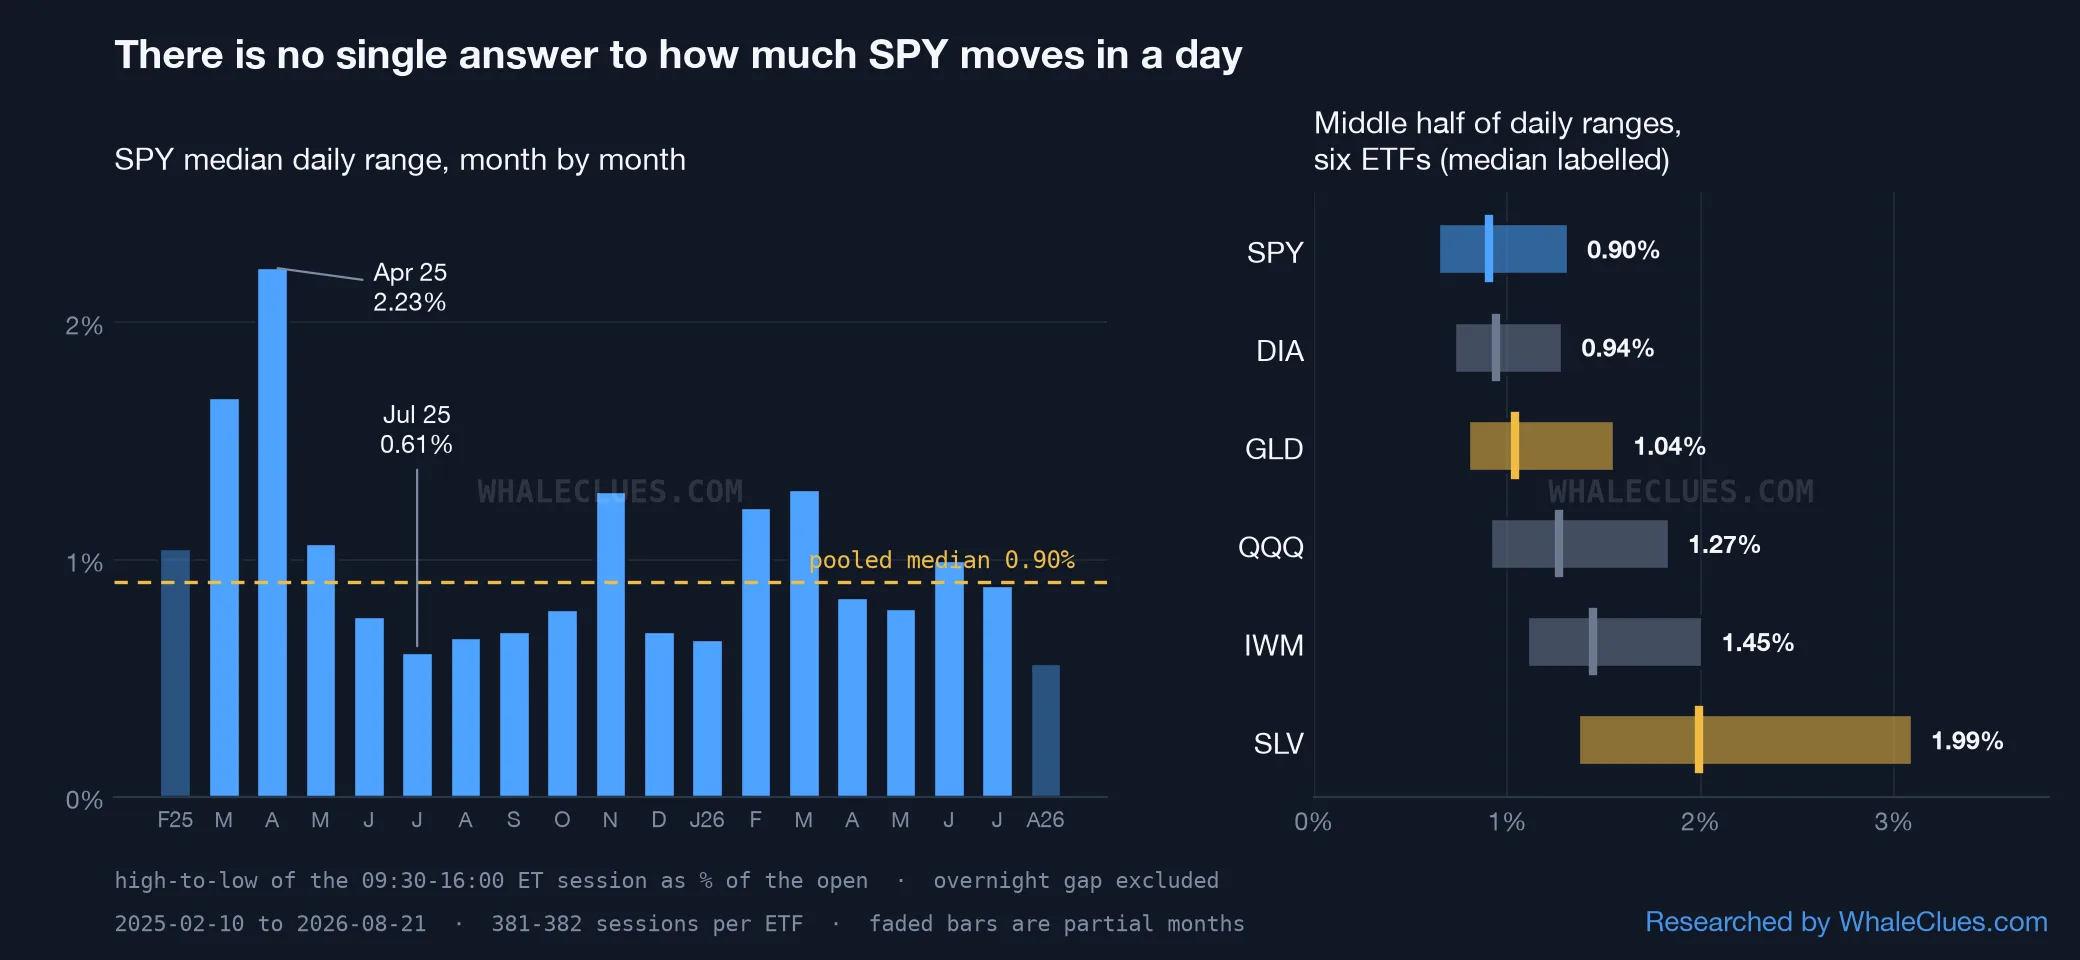
The typical SPY session travels 0.904% from its high to its low. The average session travels 1.129% — and 66.23% of sessions come in below that average. The middle half of sessions ran 0.642% to 1.313%, the calmest tenth stayed under 0.489%, the busiest tenth cleared 1.918%, and the widest single session moved 10.798%. Over 382 sessions, no one number describes the day — the monthly median alone swung from 0.61% to 2.23% inside this window.
What is SPY's average daily range?#
Both answers are correct, and they are not the same number. The median is 0.904%; the mean is 1.129% — 1.25× the median, pulled up by a handful of violent sessions.
| SPY regular-session range | Value |
|---|---|
| Calmest 10% of sessions (10th percentile) | under 0.489% |
| Typical session (median) | 0.904% |
| Busiest 10% of sessions (90th percentile) | over 1.918% |
| Widest session in the window (2025-04-09) | 10.798% |
SPY, 2025-02-10 to 2026-08-21, n = 382 regular sessions (09:30–16:00 ET), one-minute bars. Range = (session high − session low) ÷ session open, per day. The same 382 sessions produce every row. Three early-close half-sessions in the window — 2025-07-03, 2025-11-28 and 2025-12-24, each with its last bar just after 13:00 ET instead of 16:00 — are excluded, because a three-and-a-half-hour session cannot be compared with a six-and-a-half-hour one.
The widest day is 11.9× the median. That single session is why the mean and the median disagree.
Range or ATR? They are different numbers#
This note measures intraday range: high minus low inside the regular session only. It deliberately excludes the overnight gap. Average true range does not — true range folds in the distance from the prior close, so it is always at least as large.
On the 381 SPY sessions that have a prior full session to measure against, the median intraday range is 0.907% (the median shifts a hair on the 381-session subset) and the median gap-inclusive true range is 1.022% — the true-range figure is 12.6% wider at the median. The median overnight move, prior close to next open, is 0.304%, and on 39.37% of those sessions the prior close finished outside the next day's high–low range entirely, which is exactly when the gap adds to true range rather than hiding inside it.
So if you came here from an ATR reading, expect roughly an eighth more than the numbers on this page. To line the two up: the ATR(14) on your chart is a 14-day rolling mean of true range, and most platforms report it in dollars — divide it by price to put it on this page's percentage scale. Expect the result to sit above the 1.022% median even after that conversion, because a rolling mean inherits the same right-tail skew that puts the daily mean above the daily median here. Neither is wrong. They answer different questions: intraday range is what a position opened and closed inside the session could have travelled; true range is what a position held overnight was exposed to.
Why is the average day above average?#
Because the distribution is right-skewed, and skew is the normal shape for a range. A session cannot travel less than zero, but it can travel 10.798%.
Of the 382 sessions, 253 (66.23%) fell below the 1.129% mean and only 129 (33.77%) exceeded it. Two sessions in three are quieter than "average". The tail does the damage: 35 sessions (9.16%) ranged more than 2%, and those 35 days account for 25.13% of the total range summed across all 382. One session in eleven carries a quarter of the movement.
This is why quoting the mean sets the wrong expectation. If you size a position against 1.129% and session after session comes in nearer 0.904%, nothing is broken — you picked the statistic that describes the rare day.
There is no stable "normal" to return to#
This is the finding that kills any single-number answer. Split the same 382 sessions by calendar month and the SPY median range runs from 0.612% (July 2025) to 2.232% (April 2025) — a 3.65× spread across the 17 complete months in the window. Including the two partial months at the edges widens it to 3.94×.
Only 2 of the 19 calendar months had a median range within ±10% of the pooled 0.904% median. All but two of the nineteen months were meaningfully quieter or louder than "normal". The pooled number is an average of regimes, not a description of any of them.
And the regime is not a mystery on the day — it is largely visible from yesterday. Consecutive SPY sessions correlate at r = 0.673 on range. Sort the 381 paired sessions by the prior day's quartile: after a session in the calmest quartile, the next session's median range is 0.674%; after a session in the widest quartile, 1.308% — 1.94× as wide, on 95 sessions each. Yesterday's session tells you more about today's likely range than the eighteen-month average does. Whether a wide day is also a more tradable one is a separate question: are volatile days better for trading measures how much of the range becomes net movement.
When in the day does the range get built?#
Half of it lands in the first hour. The median SPY session had 54.47% of its final high–low range already established by 10:30 ET, with the middle half of sessions between 41.96% and 72.31%. On 6.28% of sessions (24 of 382) more than 90% of the day's range was set by 10:30 — the remaining five and a half hours added almost nothing.
The other five ETFs#
Same window, same definition, same construction — median range and middle half, in ascending order: SPY 0.904% (0.642–1.313), DIA 0.943% (0.723–1.285), GLD 1.041% (0.797–1.552), QQQ 1.269% (0.911–1.835), IWM 1.445% (1.102–2.008), SLV 1.993% (1.363–3.091). SPY and QQQ contribute 382 sessions each; DIA, GLD, IWM and SLV contribute 381, one session being absent from those four. The ordering is unsurprising — SLV's median session is 2.21× SPY's — but note that SLV's 25th percentile (1.363%) sits above SPY's 75th (1.313%). A quiet day in silver is busier than a busy day in SPY.
What this does not say#
Range is not profit. A 2% session is 2% of travel available to somebody with perfect timing, in both directions. It says nothing about which way price went, or whether any of it was capturable after spread and slippage.
This is descriptive, not predictive. The percentiles above are what happened, not what will. The one forward-leaning number here — the 1.94× persistence between consecutive sessions — is a conditional median, not a forecast for any single day, and the spread inside each condition remains wide.
It excludes the overnight gap by construction, which for anyone holding positions past 16:00 ET is a material omission — see the true-range contrast above.
It excludes three early closes and covers one eighteen-month window that happens to contain April 2025, whose 2.232% median range is 3.65× the quietest month's. A window without such a month would produce a lower mean and a smaller mean-median gap. That fragility is the point of the regime section, not a caveat to it.
Related reading#
- The calendar effects are real and still useless — the same range split by weekday, and why the ordering does not survive being applied to tomorrow.
- Best time of day to buy an ETF — where inside the session that range actually gets built.
- The overnight gap is mostly over before you see it — the piece this note's definition deliberately leaves out.
See these levels on a live chart
Whale-sized prints, XJER and key levels on one order-flow chart.