The Calendar Effects Are Real and Still Useless
Scope: measured on the ETFs listed (SPY, QQQ, IWM, DIA, GLD, SLV). Findings apply to the instruments measured and do not automatically transfer to other markets.
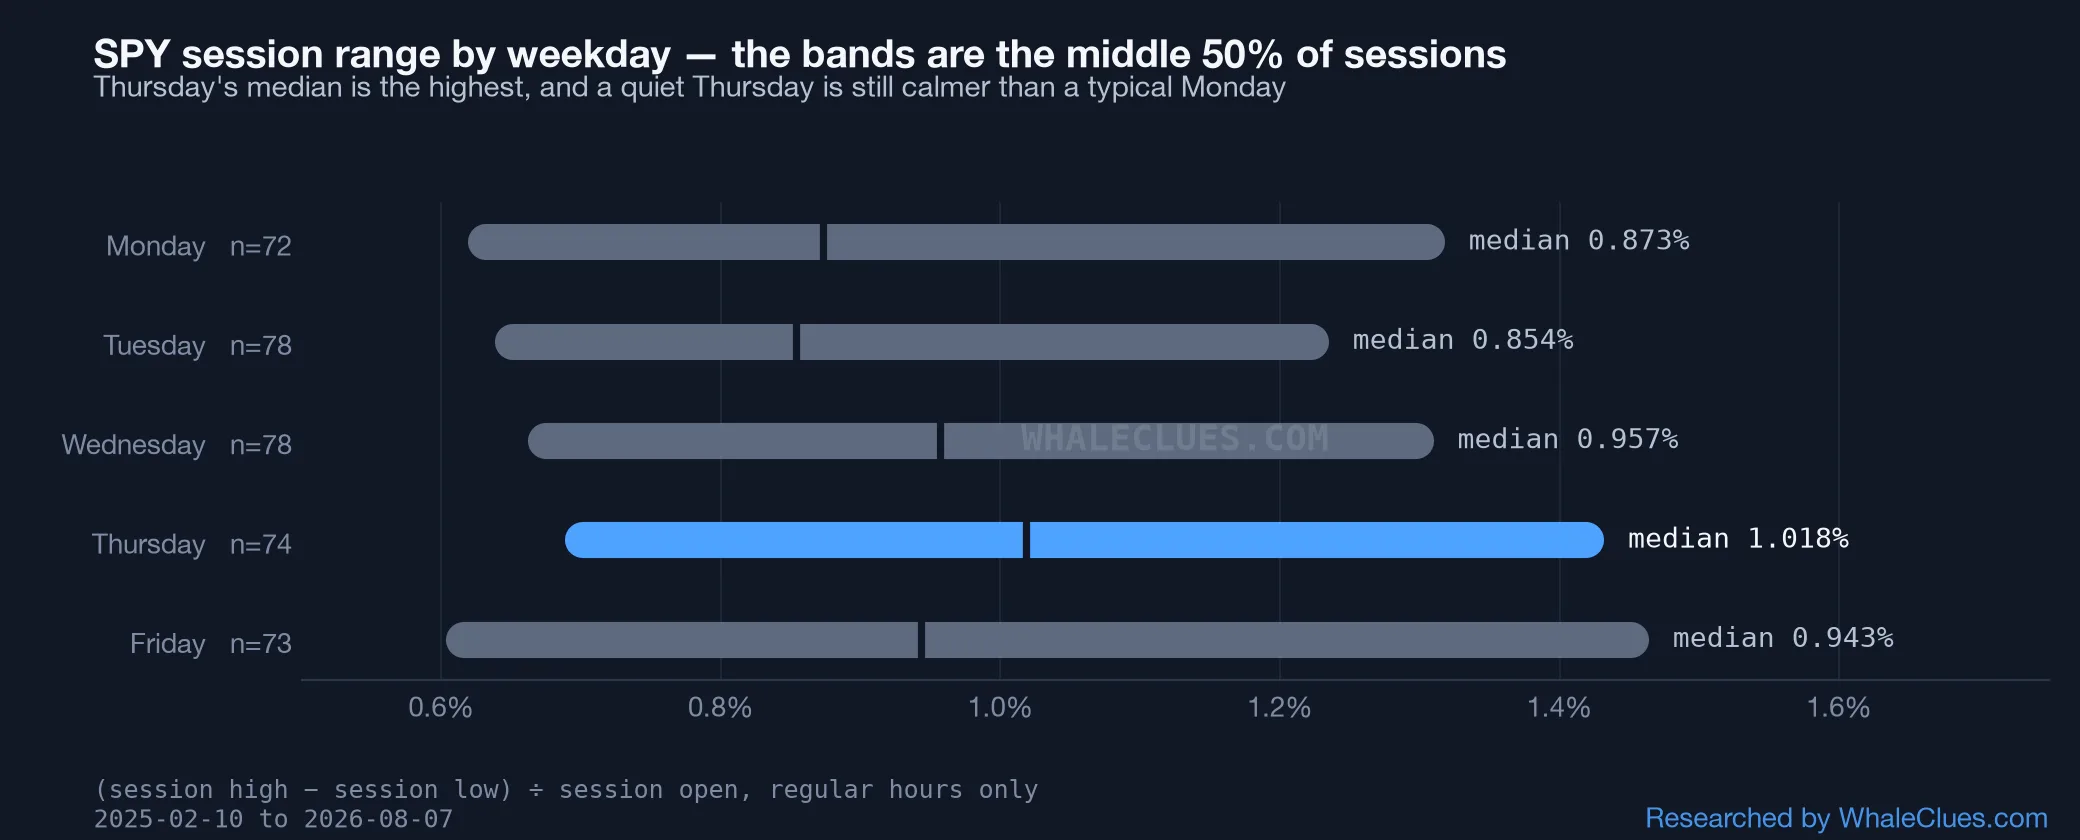
Thursday has the widest median session in both SPY and QQQ — and knowing that tells you nothing about next Thursday. The median is 1.018% against Monday's 0.873% on SPY, an ordering that repeats independently on QQQ. But the middle half of Thursdays runs 0.701% to 1.419%, and the middle half of Mondays runs 0.632% to 1.305%. The two overlap almost completely.
The ordering is real#
Two instruments, measured separately, put the days in nearly the same order. That is not what noise usually does.
| Weekday | SPY median range | QQQ median range | SPY sessions |
|---|---|---|---|
| Monday | 0.873% | 1.134% | 72 |
| Tuesday | 0.854% | 1.151% | 78 |
| Wednesday | 0.957% | 1.274% | 78 |
| Thursday | 1.018% | 1.413% | 74 |
| Friday | 0.943% | 1.315% | 73 |
2025-02-10 to 2026-08-07, regular session only (09:30–16:00 ET). Range = (session high − session low) ÷ session open, per day, then the median across days.
Note what this already kills: Friday is not the wild one. It ranks third on SPY and second on QQQ. The folk version of this — that Friday carries the week's volatility — does not survive contact with the data on either instrument.
And it is still useless#
Here is the same SPY data with the distribution left in rather than collapsed to a median.
| Weekday | 25th pct | Median | 75th pct |
|---|---|---|---|
| Monday | 0.632% | 0.873% | 1.305% |
| Tuesday | 0.651% | 0.854% | 1.222% |
| Wednesday | 0.675% | 0.957% | 1.297% |
| Thursday | 0.701% | 1.018% | 1.419% |
| Friday | 0.616% | 0.943% | 1.451% |
Same window and definition. n = 72–78 sessions per weekday.
A quiet Thursday (0.701%) is calmer than a typical Monday. A busy Monday (1.305%) is wider than a typical Thursday. The gap between the weekday medians is 0.16 percentage points; the spread within a single weekday is 0.7. The between-day signal is roughly a fifth the size of the within-day noise.
So both statements are true at once: the ordering is probably real, and it is worth nothing on any particular day. The mistake is not believing in the effect — it is believing an effect that survives averaging will survive being applied to tomorrow.
Month-end: not measurable here, and worth saying so#
The last trading day of the month has a median SPY range of 0.962% against 0.921% for every other day. QQQ shows 1.432% against 1.278%.
Both point the same way, and neither is a result: there are 19 month-end sessions in this window against 356 ordinary ones. A difference this small on a sample this size is indistinguishable from chance, and no amount of restating it changes that. The honest label is undetermined — not "no effect".
That is itself the practical point. A calendar effect that occurs twelve times a year needs years of data to test. The rarer the pattern, the longer you must wait to learn whether it was ever there — and the more confidently it tends to get asserted in the meantime.
Are options-expiration Fridays different?#
Yes, in shape rather than in size, and the monthly and quarterly versions differ from each other. On the third Friday of every month, when listed options expire, SPY traded about a fifth more shares than the ordinary days around it, but a smaller slice of the day went through the closing auction, the single 16:00 print in which the exchange matches every end-of-day order at one price. On the five quarterly expirations in the window, the "triple witching" Fridays when index futures, index options and stock options all expire together, volume ran higher still and the closing auction took a larger slice than usual, not a smaller one. For scale: on an ordinary Monday-to-Thursday session the 16:00 minute carries a median 3.2% of SPY's regular-hours volume; on monthly expirations 2.6%; on the quarterly ones 3.4%.
| ETF | Monthly expiration: volume vs nearby days | Monthly: close-minute share vs nearby | Quarterly expiration: volume vs nearby | Quarterly: close-minute share vs nearby |
|---|---|---|---|---|
| SPY | 1.22× (10 of 12 days above) | 0.78× (2 of 12 above) | 1.29× (5 of 5 above) | 1.14× (4 of 5 above) |
| QQQ | 1.17× (11 of 12) | 0.78× (3 of 12) | 1.22× (4 of 5) | 1.43× (4 of 5) |
| IWM | 1.30× (10 of 12) | 0.89× (5 of 12) | 1.21× (5 of 5) | 1.26× (4 of 5) |
| DIA | 1.19× (8 of 12) | 0.78× (3 of 12) | 1.16× (4 of 5) | 1.05× (3 of 5) |
2025-02-10 to 2026-08-28, regular session only. "Nearby days" = the median of every non-expiration session within 30 calendar days either side of that Friday, so each expiration is compared with its own neighbourhood rather than with a year-wide average. Volume = regular-hours shares; close-minute share = the 16:00 minute's volume, which carries the closing auction, as a fraction of the session. Ratios are medians across expirations; monthly n = 12, quarterly n = 5, which is why the counts of days above the neighbourhood are shown alongside them. The window holds 19 third Fridays; two fell on exchange holidays (Good Friday, 18 April 2025, and Juneteenth, 19 June 2026) and have no session, leaving 17.
The split makes mechanical sense. Quarterly expirations coincide with index rebalances, and rebalancing trades are executed in the closing auction, so the last minute swells. A monthly expiration has no rebalance attached; the extra volume comes from positions being closed or rolled during the day, and by the close there is proportionally less left to do. Five quarterly observations is too few to put a confidence interval on that number, and the reader should treat the quarterly column as a consistent direction, not a measured magnitude. What the section does establish is the same thing as the weekday result: expiration Fridays look different on the tape, and the difference is in where the volume sits, not in anything a position could be built on.
What to take from this#
Averages compress. A weekday median is built from ~75 sessions that ranged from calm to violent, and the number that comes out the other end describes none of them. Before acting on any statistic of this shape, ask for the spread — if nobody publishes the spread, the ordering is all you have, and an ordering is not a forecast.
What this does not say#
It does not say weekday effects are absent — the cross-instrument agreement suggests something is there. It says the effect is too small relative to daily variation to guide a position.
It also measures range, not direction. A wide day is not a profitable day; these numbers say nothing about which way price went.
And this is one 18-month window. A different regime could reorder the days entirely, which is precisely the kind of claim that needs re-testing rather than citing.
Related reading#
- Best time of day to buy an ETF — where inside the session that range gets built.
- The overnight gap is mostly over before you see it
- Key levels on the chart
See these levels on a live chart
Whale-sized prints, XJER and key levels on one order-flow chart.