Point of Control Hit Rate — What 2,264 Sessions Actually Show
Scope: measured on the ETFs listed (SPY, QQQ, IWM, DIA, GLD, SLV). Findings apply to the instruments measured and do not automatically transfer to other markets.
Across 2,264 consecutive-session pairs on six US-listed ETFs, the prior session's point of control fell inside the next session's regular-hours range 50.75% of the time. The prior session's closing price — which requires no volume profile at all — was touched 53.49% of the time. The POC lost to the boring control, and the paired test says that is not noise (z = −3.37, p = 0.0007).
All 15 research notes
01Claims retail traders inherit — tested
Calendar effects, tested Reversal stories need controls02Before you read any indicator
When futures actually trade Best time of day to buy an ETF Premarket and after hours The gap before you see it ETFs vs futures SPX vs SPY vs ES Do SPY and QQQ move together?03The account is a variable too
Why accounts blow up The account is a variable04How much the levels move
Call and put walls, explained05Whether the levels carry information
Point of control, tested06What the executed trades add
One market, many tapes Order flow + gamma confluenceWhat exactly was measured#
For each ETF and each session, that day's regular-hours volume was binned by price and the bin holding the most volume was taken as the day's POC. The question asked of the next session is one yes/no: did its regular-hours high–low range contain that price? Three alternative levels went through the identical test on the identical 2,264 pairs.
The session is 09:30:00–16:00:00 ET. Bins are 0.025% of the session's opening price wide — about 16 cents on SPY — which leaves the median day with between 33 (SPY) and 64.5 (SLV) occupied bins. The POC price is the bin's midpoint. Across all 2,768 ETF-days in the dataset — all eight ETFs, IBIT and ETHA included — there was not a single tie for the top bin. The closing auction falls in the session's last minute and is included: it carries 0.99% to 3.32% of regular-hours volume depending on the ETF, so it shapes the profile without deciding the POC. The winning bin holds a median 6.15% to 9.92% of the day's volume.
Same-day touches are excluded by construction: price traded at the POC — that is what makes it the POC — so counting one would be counting the definition.
The comparison that decides it#
| Level, all taken from the prior session | Touched next session | Wilson 95% | Median distance from next open |
|---|---|---|---|
| Prior closing price | 53.49% | [51.43, 55.54] | 0.449% |
| Point of control | 50.75% | [48.69, 52.81] | 0.494% |
| POC mirrored across the next open | 48.98% | [46.93, 51.04] | 0.494% |
| Prior mid-range, (high + low) / 2 | 48.54% | [46.49, 50.60] | 0.544% |
2,264 consecutive-session pairs — the same 2,264 for every row — on SPY, QQQ, IWM, DIA, GLD and SLV, 2025-02-10 to 2026-08-21, one-minute bars. A touch means the next session's 09:30–16:00 ET high–low range contains the price. Distance is expressed as a percentage of the next session's opening price. The three early-close sessions in the window are dropped from both sides of every pair. Intervals are Wilson 95%.
Read the third row first — it is the one doing the work. It is not a level. It is an arbitrary price built to sit exactly as far from the next open as the POC, on the opposite side — same distance, zero volume-profile content. It gets touched 48.98% of the time. The POC beats it by 1.77 percentage points, and the paired test on that gap returns z = +1.26, p = 0.21. At this sample size that is indistinguishable from zero.
Distance is doing almost all of the work#
Sort every level by how far it sits from the next session's open and the picture resolves. Levels within 0.25% of the open are touched between 82.85% and 86.42% of the time; levels more than 1% away, between 14.21% and 18.75%. Each of those ranges spans the five reference prices tested, with each level contributing between 468 and 729 pairs per bucket. That is a 72.21-point swing, and distance alone produces it.
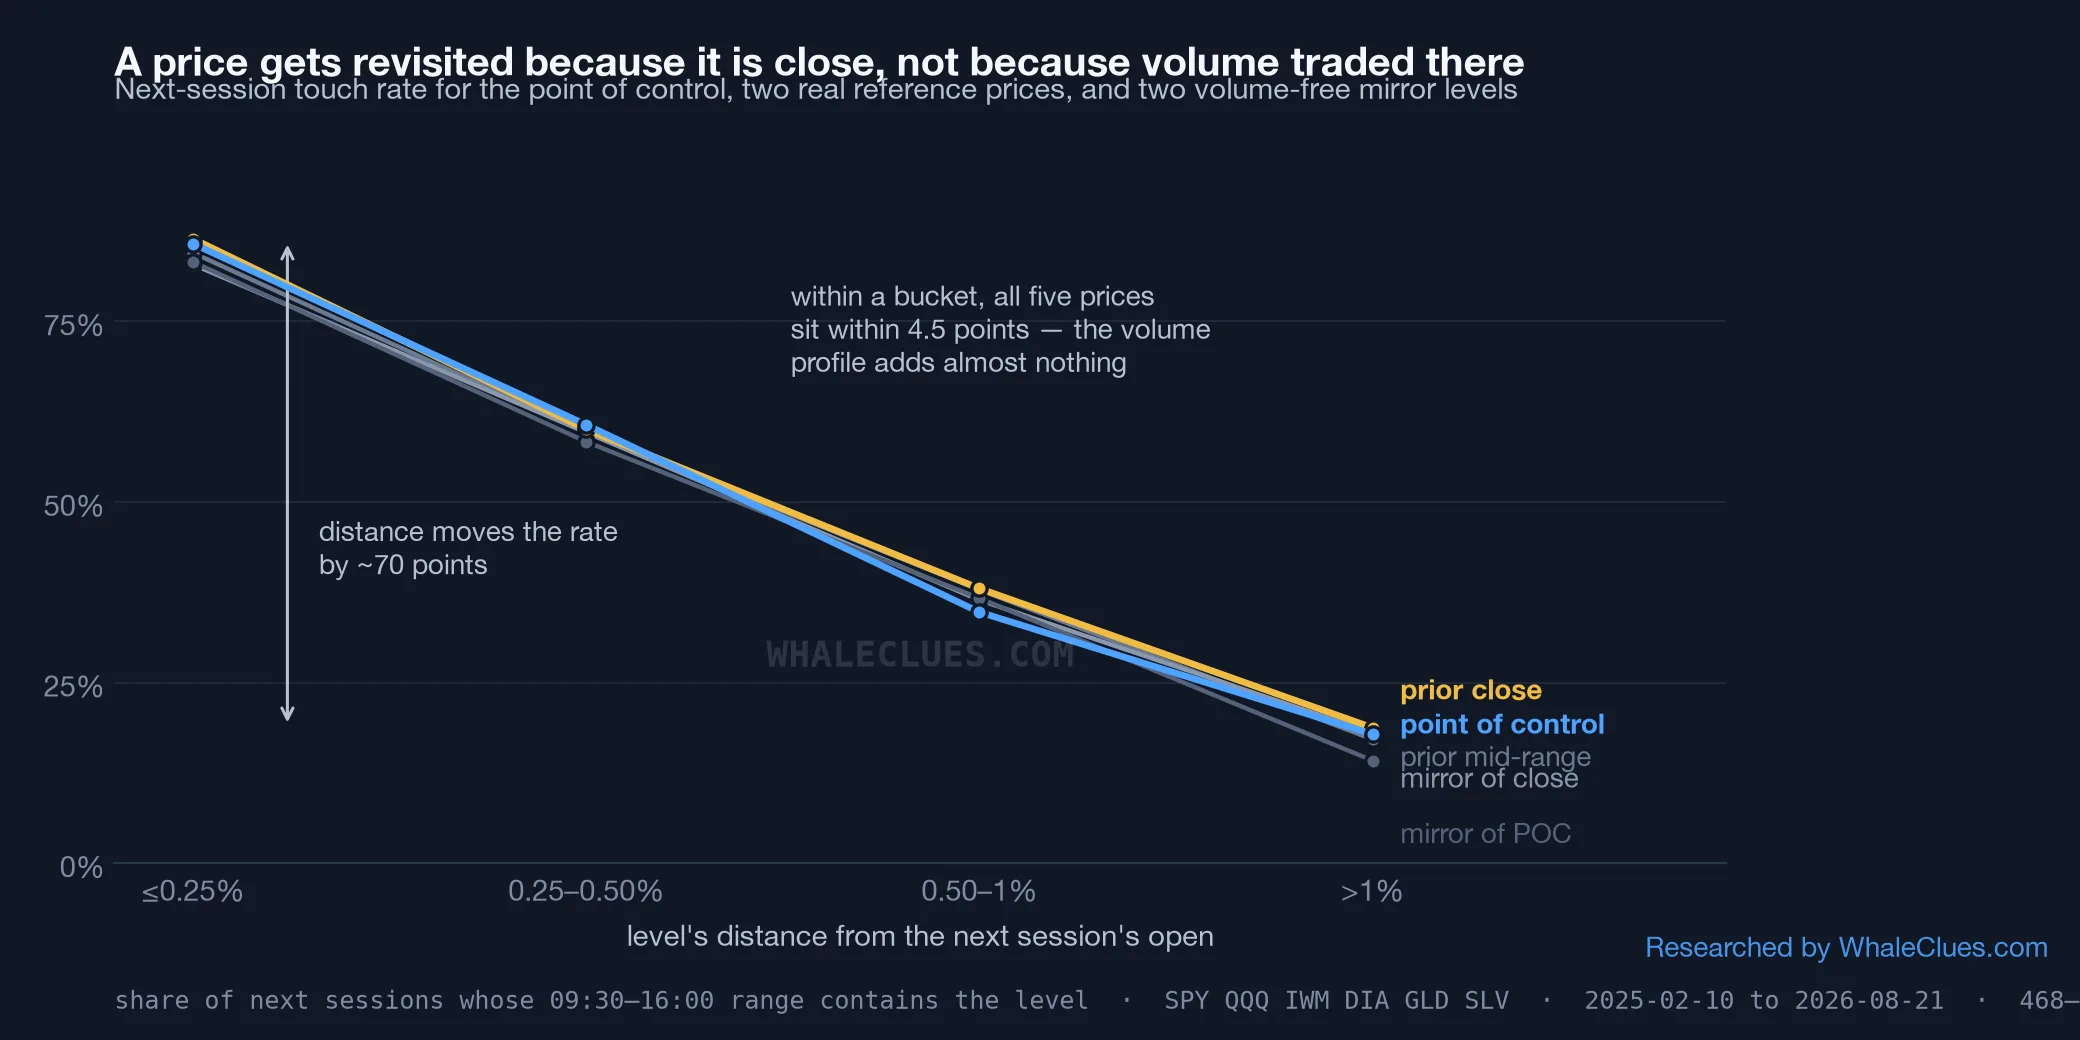
Inside each distance bucket it barely matters what the level is. Across the five reference prices tested — POC, prior close, prior mid-range, and the two mirrored controls — the spread from best to worst is 3.57 points in the nearest bucket, then 2.35, 3.28 and 4.54 points as distance grows. Paired POC-versus-mirror tests run inside each bucket return p = 0.24, 0.53, 0.56 and 0.11. Nothing.
So, at least on these instruments and this construction, a POC hit rate is mostly arithmetic about how far that POC ended up from tomorrow's open, and only marginally about volume. A volume histogram is a slow summary of where price has already spent time. That is exactly why it sits near where price is likely to be — and exactly why it carries no more information about tomorrow than the closing price does.
There is a tell in the numbers. The POC, touched 50.75%, beats its distance-matched mirror at 48.98% — a gap of 1.77 points. The prior close, touched 53.49%, beats its own mirror at 51.72% — also 1.77 points, the same figure on the same 2,264 pairs. Whatever small edge a genuine level holds over a fabricated price at equal distance, the volume profile is not the source of it.
Most of the revisiting happens early, for every level#
Of the next-session POC touches that happen at all, 71.02% have already happened by 10:30 ET. In rate terms the POC is touched 36.04% of the time by 10:30 and 50.75% by the close. The prior close behaves the same way: 39.05% by 10:30, 53.49% by the close, with 73.00% of its touches complete in the first hour. That is a property of the trading day, not of the point of control.
What this does not say#
This measures where volume was, not where information is. The study answers one narrow question — was the level inside the next day's range — and says nothing about what happened on arrival: rejection, pause, or straight through. Nothing about entries, stops, or costs. Arrival behaviour is a separate, conditional question this note does not test — quoting these numbers as evidence for fading into the POC would be as wrong as quoting them against it.
The result is not fragile to the bin width, and not hiding in one name. Widening bins to 0.05% and 0.10% of the open moves the POC rate to 50.57% and 50.09%. Per ETF, the POC trails the prior close in five of six: DIA 54.38% against 63.40%, SPY 56.88% against 60.58%, IWM 58.09% against 61.54%, GLD 39.52% against 41.11%, SLV 36.87% against 37.14%. QQQ is the one exception, at 58.73% against 57.14% — a 1.59-point lead on 378 pairs. One reversal of 1.59 points among six comparisons, at a gap far below any significance threshold on that sample, is exactly what noise is expected to produce; treating it as the exception that saves the level is reading the residue, not the signal. Note also that the pooled 50.75% sits below four of the six per-ETF POC rates — the two metals, GLD at 39.52% and SLV at 36.87%, drag the pool down.
A second denominator appears once, and here it is in the open. IBIT and ETHA only start in this dataset on 2025-09-22, so they cannot join the 2,264. On their own 452 pairs the POC was touched 38.05% of the time against 40.49% for the prior close and 45.35% for the distance-matched mirror — the mirror beating the POC outright. Different asset, shorter window, same conclusion.
4.11% of the regular-hours bars carried no vwap and were assigned to a bin by (high + low + close) / 3 instead. Bins are wide relative to one minute's range, so this is unlikely to move a POC — but it is a substitution, not a measurement.
This is US-listed ETFs, February 2025 to August 2026. Roughly eighteen months and one venue structure. It does not transfer to other instruments, and the magnitudes belong to this sample.
Related reading#
- Best time of day to buy an ETF — where the day's volume actually concentrates, which is what a volume profile summarises.
- The overnight gap is mostly over before you see it — the gap between prior close and next open is the variable driving every number above.
- Before you believe a reversal story — what a price touching a level does and does not license you to conclude.
See these levels on a live chart
Option-derived levels and futures tape on one timeline.